|
Report Contents Report#:EIA/DOE-0573(98)
Related Links |
Energy Intensity Versus Carbon Intensity in Emissions Trends Weather-Adjusted Carbon Dioxide Emissions Adjustments to Energy Consumption Other Carbon Dioxide Emissions
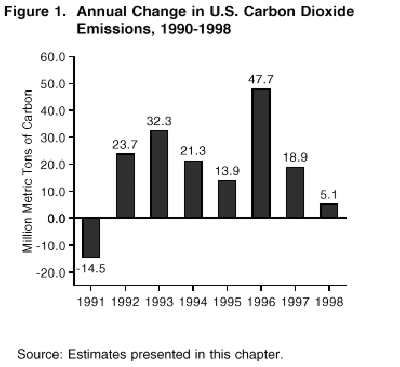
Total 1998 emissions of carbon dioxide were 1,495.5 million metric tons of carbon (Table 4), or 5.1 million metric tons (0.3 percent) more than in 1997--the slowest rate of growth since 1991, when a recession in the U.S. economy caused emissions to decline. The slow growth of carbon emissions in 1998 occurred in spite of 3.9-percent annual growth in U.S. real gross domestic product (GDP). Table 4. U.S. Carbon Dioxide Emissions from Energy and Industry, 1990-1998 In the United States 98 percent of carbon dioxide emissions are caused by the combustion of fossil fuels; consequently, carbon emissions and energy use are highly correlated. Historically, economic growth, the weather, and movements in energy prices have caused year-to-year fluctuations in energy consumption and resulting carbon emissions (Figure 1). Figure 1. Annual Change in U.S. Carbon Dioxide Emissions, 1990-1998 Residential and commercial energy consumption is dominated by electricity use for air conditioning and fuel use for winter heating. The United States experienced a warmer-than-normal summer in 1998 with cooling degree-days 14.4 percent above normal, followed by a warm winter with heating degree-days 12.1 percent below normal.(19) In terms of energy demand, however, heating degree-days outweigh cooling degree-days. Thus, the warmer winter more than offset the warmer summer. As a result of the weather, residential emissions of carbon dioxide declined by 0.1 percent, and commercial sector emissions rose by only 0.2 percent. Industrial--and especially manufacturing--energy consumption, in principle, is much less affected by the weather and more strongly affected by economic fluctuations. In 1998 industrial energy emissions declined by 1.3 percent. The underlying cause of the decline in industrial emissions is not entirely clear, but a significant contributing factor was slow growth in some of the most energy-intensive basic industries (chemicals and paper products) and an actual decline in the output of at least one (primary metals) while less energy-intensive industries expanded rapidly. The industrial category also includes farms, whose energy consumption is affected by the weather. Electricity consumption growth continued to outpace other energy in 1998 as measured by generation from electric utilities. The 2.8-percent growth in electric utility output was closer to the rate of economic growth than was the growth in consumption of other energy forms. The amount of carbon released per kilowatthour (carbon output rate) increased for electricity generation in 1998 as more carbon-intensive oil was consumed than in 1997. The increase in the carbon output rate caused electricity-related carbon dioxide emissions to rise by 3.2 percent, from 533 million metric tons of carbon in 1997 to 550 million metric tons in 1998. Early estimates indicate that nonutility generators emitted an additional 56 million metric tons of carbon into the atmosphere, bringing the total to 606 million metric tons.(20) Carbon dioxide emissions from energy production and industrial processes (noncombustion emissions) together accounted for about 2 percent of carbon dioxide emissions in 1998, or 27.9 million metric tons. These sources contributed 0.5 million metric tons to the 1998 rise in emissions (Table 4). Emissions from cement production processes (excluding the energy portion) rose from 10.3 million metric tons to 10.6 million metric tons, and emissions from natural gas flaring increased from 4.2 million metric tons to 4.3 million metric tons.
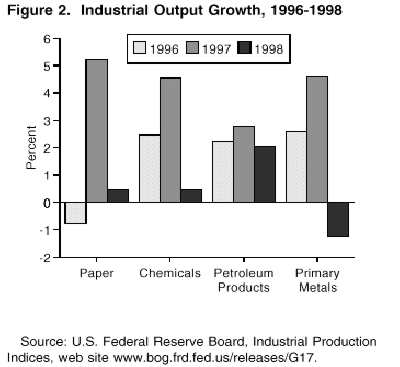
Year-to-year changes in energy consumption and carbon dioxide emissions tend to be dominated by weather, economic fluctuations, and movements in energy prices. During the 1990s, the greatest growth in carbon emissions occurred in 1993 and 1996, both colder-than-average years with heating degree-days 17 percent above 1990 (Figure 1). Economic growth, however, was faster in 1996, resulting in higher emissions growth than in 1993. The next highest growth in emissions occurred in 1992, 1994, and 1997. In 1992 the Nation had both moderate GDP growth and a higher number of heating degree-days than in 1991. Both 1994 and 1997 were characterized by stronger GDP growth than 1992, but decreases in heating degree-days from the year before offset the GDP growth. In 1995, when economic growth was moderate and there was almost no change in heating degree-days from 1994, the growth of carbon emissions was moderate. While 1998 had strong economic growth, it was warmest year in the decade of the 1990s. The decline in heating degree-days from 1997 offset much of the increase in emissions related to economic growth. The only year of the decade in which the economy slowed was 1991, and with only a moderate rise in heating degree-days from the year before, emissions were lower. Over longer time spans, changes in consumption are influenced by other factors such as population shifts and energy consumers' choice of fuels, appliances, and capital equipment (e.g., vehicles, aircraft, and industrial plant and equipment). The energy-consuming capital stock of the United States--the cars and trucks, airplanes, heating and cooling plants in homes and businesses, steel mills, aluminum smelters, cement plants, and petroleum refineries--change slowly from one year to the next, because capital stock is retired only as it breaks down or begins to operate inefficiently. For this year's report, the sectoral shares presented below (Table 5) were adjusted from the original data source. A detailed explanation of the adjustments is provided in Appendix A. Table 5. U.S. Carbon Dioxide Emissions from Energy Consumption by End-Use Sector, 1990-1998Residential emissions accounted for 19 percent of 1998 U.S. energy-related carbon dioxide emissions. More than two-thirds of that amount was accounted for by the residential sector's pro-rated share of electric utility emissions. Electricity-related residential emissions increased by 5.1 percent in 1998 compared with 1997, probably due to a 22-percent increase over 1997 in national-level cooling degree-days, which would stimulate electricity consumption for air conditioning. In contrast, emissions from the direct combustion of fuels in the residential sector (primarily natural gas) declined by 9.5 percent as a result of lower winter heating demand, although minor amounts of fuels were consumed directly for water heating, cooking, and clothes drying. A much warmer-than-normal winter, with heating degree-days 15 percent lower in 1998 than in 1997, was the primary cause of the decline. Total carbon emissions from the residential sector declined by 0.1 percent in 1998 (Table 9). Year-to-year residential sector emissions are heavily influenced by the weather. Over longer periods, the movement of populations into the Sunbelt tends to increase summer air conditioning consumption and promote the use of electric heat pumps, which increases indirect emissions from electricity use. Growth in the number of households, resulting from increasing population and immigration, contributes to more residential energy consumption. In addition, the trend in residential homes is to more living space, which needs to be lighted, heated, and cooled. On the other hand, improvements in building shell efficiency offset some of the effect of the trend toward larger living spaces. Since 1990, residential sector carbon emissions have grown at an annual rate of 1.5 percent. In 1998 they were 31.4 million metric tons higher, accounting for 22.4 percent of the total increase in emissions from fossil fuel use since 1990. Table 9. U.S. Carbon Dioxide Emissions from Energy Use in the Residential Sector, 1990-1998 Commercial sector emissions account for about 16 percent of total emissions, of which almost three-quarters is the sector's pro-rated share of electricity emissions. Although commercial sector emissions largely have their origin in the space heating and cooling requirements of structures such as office buildings, lighting is a more important component of energy demand than it is in the residential sector. Thus, although commercial sector emissions are strongly affected by the weather, they are affected less than residential sector emissions. In the longer run, because commercial activity is a factor of the larger economy, emissions from the commercial sector are more affected by economic trends and less affected by population growth than are emissions from the residential sector. Emissions from the commercial sector's pro-rated share of electricity consumption increased by 2.3 percent in 1998, while direct combustion of fuels (dominated by natural gas, as in the residential sector) declined by 5.8 percent. Overall, emissions increased by 0.2 percent in 1998 (Table 10). Since 1990, the growth in carbon emissions from the commercial sector has averaged 1.8 percent per year--the most rapid growth of the four energy-use sectors. Since 1990, commercial sector emissions have risen by 31.7 million metric tons, accounting for 22.6 percent of the total increase in energy-related emissions since 1990. Table 10. U.S. Carbon Dioxide Emissions from Energy Use in the Commercial Sector, 1990-1998 Transportation sector emissions accounted for almost one-third of total energy-related carbon dioxide emissions in 1998. Almost all (98 percent) of transportation sector emissions result from the consumption of petroleum products, particularly, motor gasoline (61 percent of transportation sector emissions); middle distillates (diesel fuel), at 20 percent; jet fuel (13 percent of the total), and residual oil (i.e., heavy fuel oil, largely for maritime use) at 3 percent of total emissions. Motor gasoline, of course, is largely used in automobiles and light trucks, and middle distillates are used in heavy trucks, locomotives, and ships. Emissions attributable to the transportation sector grew by 2.4 percent in 1998--from 473.4 million metric tons to 484.9 million metric tons of carbon (Table 8). Emissions from motor gasoline, by far the largest single source, grew by 2.8 percent. Jet fuel consumption expanded by 1.5 percent, and consumption of middle distillates grew by 3.7 percent. Transportation consumption of residual fuel declined by 3.8 percent, which is consistent with the trend in recent years. Table 8. U.S. Carbon Dioxide Emissions from Energy Use in the Transportation Sector, 1990-1998 Since 1990, emissions related to the transportation sector have grown annually at a rate of 1.5 percent. The growth since 1990 has meant that transportation emissions have increased by a total of 53.1 million metric tons, accounting for 37.9 percent of the growth from all sectors. Industrial sector emissions, like transportation sector emissions, accounted for about one-third of total energy-related carbon dioxide emissions in 1998. Electricity consumption accounted for 37.4 percent of total industrial sector emissions, natural gas for 29.3 percent, petroleum for 21.1 percent, and coal for 11.8 percent of total emissions. Generally, industrial sector emissions are strongly affected by the growth of the economy. Carbon emissions related to industrial activities declined by 1.3 percent in 1998--from 483.7 million metric tons to 477.7 million metric tons of carbon (Table 7). As in other sectors, the pro-rated share of electric utility emissions increased by 2.1 percent, while emissions from the direct combustion of fuels declined by 3.1 percent. Table 7. U.S. Carbon Dioxide Emissions from Energy Use in the Industrial Sector, 1990-1998 Since 1990, the growth in industrial sector emissions has averaged 0.6 percent per year. Total energy-related industrial emissions were 5.3 percent (24 million metric tons) higher in 1998 than they were in 1990, accounting for 17.1 percent of the total growth in carbon dioxide emissions related to energy consumption. The industrial sector consists of the manufacturing, construction, mining, and agricultural sectors in the United States. Of these, manufacturing accounts for 80 percent of industrial energy consumption.(21) Six industry groups--petroleum refining, chemicals and related products, primary metals, paper, food, and stone, clay and glass--collectively accounted for 87 percent of manufacturing energy consumption and 81 percent of carbon emissions (see discussion on "Energy-Related Carbon Emissions in Manufacturing"). Therefore, about two-thirds of the total carbon dioxide emissions related to industrial energy consumption can be attributed to those industries. Industrial sector emissions also include those from "nonutility electricity generators." Historically, nonutility generators have consisted largely of industrial sector autogeneration and cogeneration. In recent years, however, there have been increasing numbers of so-called "independent power producers," operating unregulated wholesale electricity generation plants. During 1998, the sale or conversion of existing electric utility plants to independent power producer status accelerated. As Figure 2 indicates, while output indices of the energy-intensive industries (paper and products, chemicals and products, petroleum products, and primary metals) demonstrated strong growth in 1997, in 1998 the paper and chemicals industries grew slowly and primary metals declined. The petroleum products industry grew at about half the rate of the economy. The "Energy-Related Carbon Emissions in Manufacturing" box discusses the importance of the energy-intensive industries to overall emissions, using data from EIA's Manufacturing Energy Consumption Survey (MECS). Figure 2. Industrial Output Growth, 1996-1998 A survey of manufacturers was conducted in 1998, but the results are not yet available. When these results become available they will shed light on how, despite strong economic growth in 1998, industrial energy demand and related emissions declined. While awaiting the results of the 1998 MECS, some evidence is available on industrial energy consumption from other sources. The Chemical Manufacturers Association (CMA) publishes an annual estimate of the energy and feedstock consumption of its members, which include most of the large chemical industry firms specializing in basic petrochemicals. The American Iron and Steel Institute (AISI) also publishes data on the energy consumption of its membership, which include much (but not all) of the American steel industry. Both CMA and AISI indicate declining energy consumption among their membership in 1998.(22)
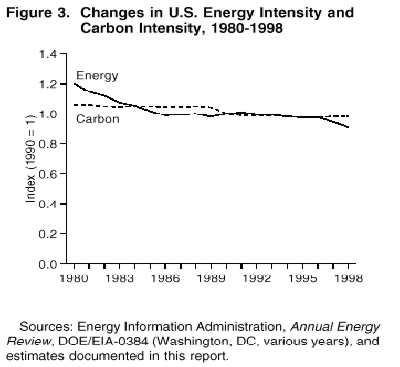
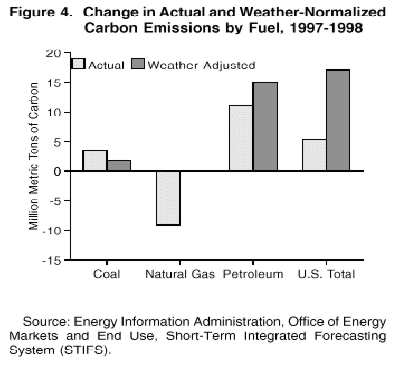
The consumption data upon which this inventory is based include only regulated electric utilities in the electricity sector. Consumption by nonutility generators is included in the industrial sector. A report prepared by the Department of Energy and the Environmental Protection Agency pursuant to the Presidential Directive of April 15, 1999, estimates that total carbon emissions from all electricity generation increased from 583.9 million metric tons of carbon in 1997 to 605.5 million metric tons in 1998, an increase of 3.7 percent, or almost the rate of growth of the economy. Subtracting the amount contained in this inventory from the total for all generation contained in that report would imply that nonutility emissions increased by 8.9 percent, from 51.1 million metric tons in 1997 to 55.7 million metric tons in 1998.(23) In this inventory, the emissions of the electric utility sector are assigned to the energy-consuming sectors presented above. However, because electric utility emissions account for 37 percent of total U.S. energy-related carbon dioxide emissions, they are also discussed separately. Carbon emissions from the electric utility sector grew at a much greater rate than national emissions between 1997 and 1998: 3.2 percent or 17 million metric tons (Table 11). Since 1990, electric utility emissions have grown by 15 percent, while overall emissions have grown by 10 percent. Table 11. U.S. Carbon Dioxide Emissions from Electric Utilities, 1990-1998 During most of the 1980s and the first half of the present decade, the carbon output rate of power generation (measured as quantity of carbon dioxide emitted per kilowatthour of electricity generated) steadily declined. Increasing power generation from nuclear power, the expansion of natural-gas-fired generation, and improving thermal efficiencies from existing plants all have contributed to this trend. Since 1995, however, the carbon output rate of power generation has begun to rise again. In 1995 nuclear power provided 22 percent of utility generation, but in 1998 it provided less than 21 percent. Petroleum-fired generation, on the other hand, rose from 2.0 percent of utility generation in 1995 to 3.4 percent in 1998. The average price of heavy fuel oil paid by electric utilities was 20 percent lower in 1998 than in 1995. In order to analyze trends in carbon emissions, it is important to evaluate both energy intensity (Btu per dollar of GDP) and carbon intensity (carbon per unit of energy consumed). When the economy grows and carbon emissions remain almost flat, as they did in 1998, it means that either the energy intensity, the carbon intensity, or some combination of both declined by nearly the same amount as economic output expanded. In 1998, energy intensity rather than carbon intensity was the principal source of low emissions growth. Carbon intensity actually rose slightly as temporarily inexpensive oil, which is more carbon-intensive than natural gas, was substituted for natural gas in the generation of electricity. These offsetting trends are discussed below. As Figure 3 indicates, the trends in carbon intensity and energy intensity have begun to diverge. Following the energy price spikes in the 1970s and early 1980s, energy intensity went through a decline until the mid-1980s. Energy intensity leveled off for about the next decade as energy prices dropped and remained stable. Energy intensity rose slightly in 1991, a recession year. Consumption of energy is relatively inelastic with respect to people's income. Therefore, consumption of energy did not fall as fast as consumption of other goods and services in the economy. In the early 1990s energy intensity began to fall again, and between 1996 and 1998 it fell by 6.6 percent. What is important about the current fall is that, unlike past declines in energy intensity, energy prices have been stable or decreasing. Various factors have contributed to this decline, and weather in particular has played a role in the drop between 1996 and 1998. Another factor is an increase in the non-energy-intensive sectors of the economy relative to the traditional energy-intensive manufacturing industries. Figure 3. Changes in U.S. Energy Intensity and Carbon Intensity, 1980-1998 Carbon intensity has shown a different pattern. Throughout the 1980s carbon intensity remained largely unchanged. Beginning in the late 1980s two trends began to emerge which affected the carbon output of electricity generators and thereby the carbon intensity of the entire economy. Independent power producers began to take an increasing share of the electricity market, and their generation mix is overwhelmingly gas-fired, a lower carbon-intensive fuel. At the same time, electric utilities began to rely less on petroleum to generate electricity and increased the operating capability of nuclear power facilities. Between 1991 and 1995 carbon intensity fell. After 1995, however, the trend was reversed as petroleum generation began to grow again and coal generation grew by 9.4 percent between 1995 and 1998 as opposed to 4.9 percent between 1992 and 1995. In 1998, carbon intensity was 1.7 percent below the 1990 level, whereas in 1996 it had fallen to 2.6 percent below. If carbon intensity had fallen by the same amount as energy intensity, emissions of carbon dioxide from fossil fuel burning would be 2.3 percent above the 1990 level of emissions, rather than the current level of 10 percent above 1990. To examine the effect of weather on 1998 reported emissions, EIA undertook a series of "weather adjusted" cases of its short-term energy forecasting model, the Short-Term Integrated Forecasting System (STIFS). This model is used primarily to prepare 2-year quarterly forecasts of U.S. energy production and consumption. Two model cases were run for the years 1997 and 1998, one in which actual weather parameters were used and another in which normal weather (heating and cooling degree-days) were used. Both cases used actual historical values for all other variables that are not determined by the model. The percentage increments from the two cases were applied to the actual values from this report in order to estimate the weather-related effect. Figure 4 illustrates actual and weather-adjusted growth in energy-related carbon emissions by fuel and for the U.S. total from 1997 to 1998. Figure 4. Change in Actual and Weather-Normalized Carbon Emissions by Fuel, 1997-1998 The weather-adjusted emissions for 1998 were 17.1 million metric tons (1.2 percent) higher than the weather- adjusted emissions for 1997, indicating that the growth in emissions would have been about three times higher had the weather been normal in both years. The 1.2-percent growth rate is the annual average rate of growth between 1990 and 1998; however, because 1998 was a year of above-average economic growth, one would expect an even higher growth rate for 1998 than the 1.2-percent average under normal weather assumptions. Total energy consumption and the carbon emissions upon which they are based correspond to EIA's coverage of energy consumption, which includes the geographic area of the United States as 50 States and the District of Columbia. However, the United States is also responsible for emissions emanating from its territories. On the other hand, the Intergovernmental Panel on Climate Change (IPCC) definition of energy consumption excludes international bunker fuels from the statistics of all countries. Therefore this emissions category is estimated and subtracted from the national total. These sources are enumerated and described as "adjustments to energy." U.S. Territories Energy-related carbon dioxide emissions for the U.S. territories are added as an adjustment in keeping with IPCC guidelines for national emissions inventories. The territories included are Puerto Rico, the U.S. Virgin Islands, American Samoa, Guam, U.S. Pacific Islands and Wake Island. Almost all the commercial energy consumed in the territories consists of petroleum products, although small amounts of coal are imported into Puerto Rico and the Virgin Islands. In 1998, total carbon emissions are estimated to have been 12 million metric tons (Table 4). This emissions estimate for the U.S. territories differs from those in past editions of this report because the entire time series has been adjusted to different consumption estimates. International Bunker Fuels International bunker emissions, accounting for about 2 percent of U.S. carbon dioxide emissions, are deducted from national emissions. The energy statistics of the International Energy Agency, using a format designed to be consistent with practice in international trade, have always excluded marine bunker fuels from domestic consumption. Marine bunker fuels are defined as fuel sold to ships moving in international trade. When the IPCC began developing its guidelines for national emissions inventories in the early 1990s, the practice of excluding marine bunker fuels was extended to international aviation fuels, defined as fuel consumed by aircraft moving between international destinations. Thus, the IPCC, in effect, invented the concept of international aviation bunkers. No country in the world, including the United States, collects the statistics needed to properly measure this concept. In the case of the United States, sufficient information is available to estimate emissions from both ships and aircraft moving internationally, using unpublished data collected by the U.S. Department of Commerce and used to prepare the services account of the U.S. balance-of-payments statistics.(24) This year's report includes, for the first time, estimates of jet fuel consumed by foreign commercial aircraft operating out of U.S. airports. The entire time series has been adjusted to reflect this new information. The current estimate continues to exclude military bunkers, pending the receipt of additional information from the U.S. Department of Defense. The international bunker fuels estimate is based on purchases of distillate and residual fuels by foreign-bound ships at U.S. seaports, and on jet fuel purchases by domestic and foreign international air carriers at U.S. airports. In 1998, approximately 30 million metric tons of carbon were emitted from international bunker fuels, or 6.7 percent more than in 1997 (Table 4). Just over half of the international bunker fuel carbon emissions are from the combustion of jet fuels, and marine bunker emissions (largely from residual fuels) account for the rest.
Energy Production In addition to emissions resulting from fossil energy consumed, oil and gas production leads to emissions of carbon dioxide from sources other than the combustion of those marketed fossil fuels. The two energy production sources estimated for this inventory are:
EIA assumes that all natural gas reported in the category "Vented and Flared Gas" is actually flared (combusted) and therefore is a carbon dioxide emission rather than a (non-combusted) methane emission. In 1998, about 4.3 million metric tons of carbon were emitted by flaring (Table 4). By computing the difference between the estimated carbon dioxide content of raw gas and the carbon dioxide content of pipeline gas, the amount of scrubbed carbon dioxide can be calculated. This amount was 4.9 million metric tons of carbon in 1998 (Table 4). Industrial Process Emissions Industrial process emissions are non-combustion industrial emissions, usually caused by chemical reactions involving carbonate rock. They accounted for about 1.2 percent of total U.S. carbon dioxide emissions in 1998. Process-related emissions from these industrial sources depend largely on the level of activity in the construction and fertilizer industries, because the principal source of emissions is the calcination of limestone to make cement and lime (although there are a large number of other, smaller sources).Carbon dioxide emissions from industrial processes accounted for 18.7 million metric tons of carbon in 1998 (Table 12), an increase of 2.5 million metric tons of carbon compared with 1990. More than one-half of the carbon dioxide emissions from industrial processes are from cement manufacture. When calcium carbonate is heated (calcined) in a kiln, it is converted to lime and carbon dioxide. The lime is combined with other materials to produce clinker (an intermediate product from which cement is made), and the carbon dioxide is released to the atmosphere. In 1998, the United States manufactured an estimated 85.5 million metric tons of cement, resulting in the direct release of carbon dioxide containing about 10.6 million metric tons of carbon into the atmosphere. (This calculation is independent of the carbon released by the energy consumed in making cement.) This represents an increase in emissions of 1.7 million metric tons of carbon or 19.2 percent compared with 1990 and an increase of about 0.3 million metric tons or 3.5 percent compared with 1997. Table 12. U.S. Carbon Dioxide Emissions from Industrial Processes, 1990-1998 There are numerous other industrial processes in which carbonate minerals are used in ways that release carbon dioxide into the atmosphere, including the use of limestone in the production of lime, in flue gas desulfurization, and in the manufacture and some uses of soda ash. Carbon dioxide is also released during aluminum smelting, when carbon anodes (with the carbon derived from nonfuel use of fossil fuels) are vaporized in the presence of aluminum oxide. Approximately 8.0 million metric tons of carbon per year are contained in emissions from these other industrial process sources. |
|||||||||||||||||||||||||||||||||||||||||||||||||||||||||||||||||||||||||||||||||||||||||||||||||||||||||||||||||||||