|
Report Contents Report#:EIA/DOE-0573(98)
Related Links |
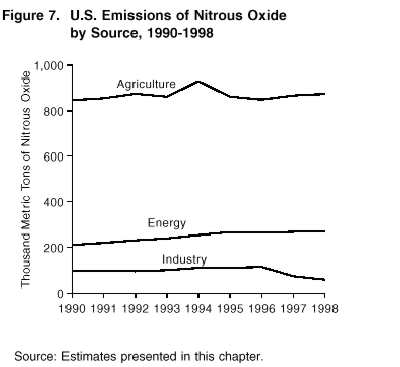
Estimated U.S. anthropogenic nitrous oxide emissions totaled 1.2 million metric tons in 1998, about 0.5 percent less than in 1998 but still 4 percent above 1990 levels (Table 22). Nearly all the increase from 1990 levels can be attributed to emissions from the nitrogen fertilization of agricultural soils, which for the first time included emissions from the biological fixation of nitrogen in agricultural soils, and emissions from mobile combustion, which grew by 33 percent between 1990 and 1995. Emissions of nitrous oxide from mobile combustion stabilized from 1995 through 1998, as growth in the light-duty truck fleet slowed and the next generation of lower-emitting catalytic converters was introduced. These trends in emissions from mobile combustion can be expected to lead to lower emissions from this source over the next few years. Table 22. Estimated U.S. Emissions of Nitrous Oxide, 1990-1998 Agricultural activities are the largest source of U.S. anthropogenic nitrous oxide emissions--primarily, the nitrogen fertilization of agricultural soils. Small quantities of nitrous oxide are also released from the burning of crop residues. Estimated emissions of nitrous oxide from agricultural sources were 0.9 million metric tons in 1998, about 1 percent above 1997 levels and 3 percent above 1990 levels (Figure 7). There are, however, large uncertainties connected with the emissions consequences of adding nitrogen to agricultural soils (see discussion box on "Inclusion of Additional Sources Produces Higher Estimates of U.S. Nitrous Oxide Emissions). Figure 7. U.S. Emissions of Nitrous Oxide by Source, 1990-1998
The second-largest source of anthropogenic nitrous oxide emissions is energy consumption, which includes mobile source combustion from passenger cars, buses, motorcycles, and trucks and stationary source combustion from commercial, residential, industrial, and electric utility energy use. Energy use w as responsible for the release of 0.3 about million metric tons of nitrous oxide in 1998, about 2 percent higher than in 1997 but 29 percent higher than in 1990. Industrial production of adipic acid and nitric acid, which releases nitrous oxide as a byproduct, accounted for emissions of about 0.06 million metric tons of nitrous oxide in 1998, a 39-percent decrease from 1990 levels and a 20-percent decline from 1997 levels (Table 22).
Nitrous oxide emissions from both mobile and stationary sources are byproducts of fuel combustion. Estimated 1998 energy-related emissions were about 0.3 million metric tons, 22 percent of total U.S. anthropogenic nitrous oxide emissions (Table 22). Emissions from energy use are dominated by mobile combustion (82 percent of 1998 totals). Nitrous oxide emissions from mobile source combustion in 1998 were 0.2 million metric tons, about 1 percent above 1997 levels (Table 23). In addition to emissions from passenger cars and light-duty trucks, emissions from air, rail, and marine transportation and from farm and construction equipment are also included in the estimates. Ninety-five percent of the emissions can be attributed to motor vehicles. The rapid growth in emissions between 1990 and 1995 is a function of increasing motor vehicle use, the shifting composition of the light-duty vehicle fleet toward light trucks, and the gradual replacement of low emitting pre-1983 vehicles in the fleet with higher emitting post-1983 vehicles. The shift to advanced three-way catalytic converters in 1996, 1997, and 1998 model year cars has stabilized emissions from this source. Table 23. U.S. Nitrous Oxide Emissions from Mobile Sources, 1990-1998 Nitrous oxide emissions from motor vehicles are caused primarily by the conversion of pollutant nitrogen oxides (NOx) into nitrous oxide (N2O) by vehicle catalytic converters. The normal operating temperature of catalytic converters is high enough to cause the thermal decomposition of nitrous oxide. Consequently, it is probable that nitrous oxide emissions result primarily from "cold starts" of motor vehicles and from catalytic converters that are defective or operating under abnormal conditions. This implies that the primary determinant of the level of emissions is motor vehicle operating conditions; however, different types of catalytic converters appear to differ systematically in their emissions, and emissions probably vary with engine size. Consequently, emissions also depend on the "mix" of vehicle age and type on the road.
During combustion, nitrous oxide is produced as a result of chemical interactions between nitrogen oxides (mostly NO2) and other combustion products. With most conventional stationary combustion systems, high temperatures destroy almost all nitrous oxide, limiting the quantity that escapes; therefore, emissions from these systems are typically low. In 1998, estimated nitrous oxide emissions from stationary combustion sources were 0.05 million metric tons, about 1 percent higher than in 1997 and 10 percent higher than in 1990 (Table 24). Nearly all the emissions increase from this source between 1990 and 1998 can be attributed to coal-fired electricity generation, which grew in response to the growing demand for electricity and improved operations at coal-fired power plants. Coal-fired combustion systems produced 61 percent of the 1998 emissions of nitrous oxide from stationary combustion, and electric utilities accounted for 56 percent of all stationary combustion emissions. Table 24. U.S. Nitrous Oxide Emissions from Stationary Combustion Sources, 1990-1998 On a global scale, agricultural practices contribute approximately 70 percent of anthropogenic nitrous oxide emissions.(40) Similarly, in the United States, agricultural activities were responsible for 71 percent of 1998 nitrous oxide emissions. About three-quarters of agricultural emissions are associated with the application of commercial and animal-manure-based fertilizers. Nearly all the remaining agricultural emissions can be traced to the management of the solid waste of domesticated animals. The disposal of crop residues by burning also produces nitrous oxide that is released into the atmosphere; however, the amount is relatively minor, at 0.002 million metric tons or 0.2 percent of total U.S. emissions of nitrous oxide from agricultural sources in 1998. Nitrous oxide emissions from agricultural activities grew by 3 percent between 1990 and 1998.
Nitrogen Fertilization of Agricultural Soils Nitrogen uptake and nitrous oxide emissions occur naturally as a result of nitrification and denitrification processes in soil and crops, generally through bacterial action. When nitrogen compounds are added to the soil, bacterial action is stimulated, and emissions generally increase, unless the application precisely matches plant uptake and soil capture.(41) Nitrogen may be added to the soil by synthetic or organic fertilizers, nitrogen-fixing crops, and crop residues. Nitrogen-rich soils, called "histosols," may also stimulate emissions. Adding excess nitrogen to the soil also enriches ground and surface waters, such as rivers and streams, which generate indirect emissions of nitrous oxide. Additional indirect emissions occur from "atmospheric deposition," in which soils emit other nitrogen compounds that react to form nitrous oxide in the atmosphere. EIA estimates that a total of 0.6 million metric tons of nitrous oxide were released into the atmosphere as a result of direct and indirect emissions associated with fertilization practices in 1998 (Table 25). Estimated emissions increased by 4 percent compared with 1990 and 2 percent compared with 1997. Table 25. U.S. Nitrous Oxide Emissions from Nitrogen Fertilization of Agricultural Soils, 1990-1998 For the first time, this year's edition of Emissions of Greenhouse Gases in the United States includes estimates of nitrous oxide emissions from biological fixation of nitrogen in agricultural soils, which added about 0.2 million metric tons of nitrous oxide emissions to 1998 estimates. The addition of this emissions source raised the 1990 estimates of emissions from the nitrogen fertilization of agricultural soils by 48 percent and the 1998 estimate by 57 percent. When crop residues are burned, the incomplete combustion of agricultural waste results in the production of nitrous oxide as well as methane (discussed in Chapter 3). In 1998, estimated emissions of nitrous oxide from crop residue burning were 0.002 million metric tons, up by 1 percent from 1997 levels (Table 22). As with methane emissions from crop residue burning, the increase from the previous year's emissions level was negligible due to a very small increase in crop production. Although emissions from this source remain very small, at about 0.2 percent of all U.S. nitrous oxide emissions, they have grown by 21 percent since 1990, largely because of a 43-percent increase in soybean production and a 19-percent increase in corn production since 1990. Solid Waste of Domesticated Animals Estimated 1998 nitrous oxide emissions from animal waste were about 0.2 million metric tons, down by 1 percent from 1997 levels but still 2 percent higher than 1990 levels (Table 26), making animal waste the second-largest U.S. agricultural source of nitrous oxide emissions, after nitrogen fertilization of soils. Nitrous oxide emissions from animal waste are dominated by emissions from cattle waste, which account for 94 percent of emissions from the solid waste of domesticated animals. Thus, changes in estimated emissions have largely been caused by changes in cattle populations, growing between 1990 and 1994, stabilizing in 1995, and declining in 1996, 1997, and 1998. The decrease in cattle populations in 1998, however, was largely offset by an increase in average cattle size. The increase in animal size resulted in the production of more waste per animal and a slightly lower overall emission rate for 1998. Table 26. U.S. Nitrous Oxide Emissions from Solid Waste of Domesticated Animals, 1990-1998 Nitrous oxide is released as part of the microbial denitrification of animal manure. The total volume of nitrous oxide emissions is a function of animal size and manure production, the amount of nitrogen in the animal waste, and the method of managing the animal waste. Waste managed by a solid storage or pasture range method may emit 20 times the nitrous oxide per unit of nitrogen content than does waste managed in anaerobic lagoon and liquid systems. Generally, solid waste from feedlot beef cattle is managed with the solid storage or pasture range method, accounting for the majority of nitrous oxide emissions. Over the past few years, the solid waste of dairy cattle in Arizona, Florida, Nevada, North Carolina, North Dakota, and Texas has been managed in anaerobic lagoon and liquid systems, helping to decrease nitrous oxide emissions to near-1990 levels. Solid waste from swine is generally managed in anaerobic lagoons and other liquid systems. Anaerobic digestion yields methane emissions but only negligible amounts of nitrous oxide.
Nitrous oxide emissions from waste management are estimated at about 0.2 million metric tons for 1998, or 2 percent of all U.S. anthropogenic nitrous oxide emissions (Table 22). During 1998, emissions from human sewage in wastewater were responsible for 96 percent of the estimated emissions from this source, and the remainder was associated with waste combustion. Estimated emissions from waste management grew by 11 percent between 1990 and 1998 and by 1 percent between 1997 and 1998. Because of the lack of reliable data and an effective estimation method, no estimate of emissions from industrial wastewater was calculated, leaving estimated emissions from waste management lower than they otherwise would be had estimation methods been available.
In 1998, estimated nitrous oxide emissions from waste combustion were 0.001 million metric tons, down by 8 percent from 1997 levels and 12 percent below 1990 levels. The total volume of waste generated in the United States increased by 28 percent between 1990 and 1998. In 1990, the share of waste burned was 11 percent. After dropping to 10 percent in 1991, the share of waste that was incinerated in the United States remained relatively stable through 1996. Thus, increasing levels of waste generation led to an increase in the total volume of waste incinerated and higher nitrous oxide emissions. The share of waste incinerated dropped from 10 percent in 1996 to 8 percent in 1998 as the share of waste recycled increased, with a corresponding drop in estimated nitrous oxide emissions.(42) Nitrous oxide is emitted from wastewater that contains nitrogen-based organic materials, such as those found in human or animal waste. It is produced by two natural processes: nitrification and denitrification. Nitrification, an aerobic process, converts ammonia into nitrate; denitrification, an anaerobic process, converts nitrate to nitrous oxide. Factors that influence the amount of nitrous oxide generated from wastewater include temperature, acidity, biochemical oxygen demand (BOD),(43) and nitrogen concentration. In 1998, nitrous oxide emissions from wastewater were about 0.02 million metric tons, a 1-percent increase from 1997 levels and a 12-percent increase from the 1990 level (Table 22). Estimates of nitrous oxide emissions from human waste correspond to population size and per capita protein intake. U.S. per capita protein intake rose steadily between 1980 and 1994, before leveling out. Data on protein intake are taken from the United Nations Food and Agriculture Organization (FAO). The FAO ended its time-series on protein intake with 1996 data. EIA has assumed that protein intake levels have been stable since then but trends seem to indicate that protein intake increases with economic growth and may now be above 1996 levels. The growth in emissions from this source since 1990 is attributable to a 9-percent increase in population and a 3.7-percent increase in per capita protein intake.(44)
Nitrous oxide is emitted as a byproduct of certain chemical production processes. Table 27 provides estimates of emissions from the production of adipic acid and nitric acid, the two principal known sources. Emissions from the combination of these two processes were 0.058 million metric tons in 1998, a decrease of 0.038 million metric tons (39 percent) since 1990 and 0.015 million metric tons (20 percent) since 1997. All the decline can be traced to decreased emissions from adipic acid production, which dropped as emissions controls added to the third of four manufacturing plants during early 1997 were in place for the entire year in 1998. Table 27. U.S. Nitrous Oxide Emissions from Solid Waste of Domesticated Animals, 1990-1998 Adipic Acid Production In the United States, three companies, which operate a total of four plants, manufacture adipic acid by oxidizing a ketone-alcohol mixture with nitric acid. Nitrous oxide is an intrinsic byproduct of this chemical reaction. For every metric ton of adipic acid produced, 0.3 metric ton of nitrous oxide is created.(45) Between 1990 and 1994, emissions from adipic acid manufacture grew slowly until they reached 0.067 million metric tons (Table 27). After remaining relatively stable in 1995 and 1996, emissions dropped sharply to just 0.012 million metric tons in 1998. Through 1996, two of the four plants that manufacture adipic acid controlled emissions by thermally decomposing the nitrous oxide. This technique eliminates 98 percent of potential emissions from the plants.(46) During the first quarter of 1997, a third plant had installed emissions controls, increasing the share of adipic acid production employing emissions abatement controls from 74 percent in 1996 to an annual average of 92 percent in 1997. Emissions from 97 percent of 1998 U.S. adipic acid production were controlled.(47) Consequently, estimated emissions of nitrous oxide from uncontrolled adipic acid production plants decreased from 0.021 million metric tons in 1997 to 0.007 million metric tons in 1998, while 1998 emissions of nitrous oxide from controlled plants remained constant at 0.005 million metric tons. Nitric acid, a primary ingredient in fertilizers, usually is manufactured by oxidizing ammonia (NH3) with a platinum catalyst. Nitrous oxide emissions are a direct result of the oxidation. The 9.4 million short tons of nitric acid manufactured in 1998 resulted in estimated emissions of 0.047 million metric tons of nitrous oxide (Table 27). This estimate was 1 percent lower than 1997 levels but 18 percent higher than 1990 levels. The emissions factor used to make this estimate was based on measurements at a single DuPont plant, which indicated an emissions factor of 2 to 9 grams of nitrous oxide emitted per kilogram of nitric acid manufactured, an uncertainty of about 50 percent (see Appendix A). |
||||||||||||||||||||||||||||||||||||||||||||||||||||||||||||||||||||||||||||||||||||||||||||||||||||