|
Report Contents Report#:EIA/DOE-0573(98)
Related Links |
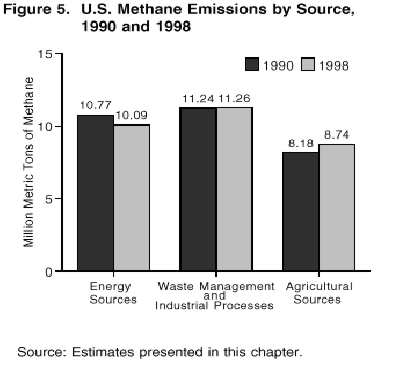
In 1998, U.S. anthropogenic methane emissions totaled 28.8 million metric tons, a decline of about 0.4 million metric tons from 1997 levels (Table 13). The decline is attributed to an increase in methane recovery for energy use at U.S. landfills, from 1.7 million metric tons to 2.2 million metric tons between 1997 and 1998 (Table 18). In order to qualify for a Federal tax credit under Section 29 of the Windfall Profits Tax Act of 1980, methane recovery systems at landfills must have been operational by June 30, 1998. During 1997-1998, landfill gas developers raced to put new projects on line to beat the deadline. Also, the U.S. Environmental Protection Agency (EPA) recently implemented the New Source Performance Standards and Emissions Guidelines for landfills, giving operators an additional regulatory incentive to capture their emissions. Table 13. U.S. Methane Emissions from Anthropogenic Sources, 1990-1998 Total 1998 methane emissions were 1.4 million metric tons below the 1990 level, a decrease equivalent to 7.7 million metric tons of carbon, or roughly 0.4 percent of total U.S. anthropogenic greenhouse gas emissions. In addition to a 1.3 million metric ton decrease in emissions from landfills since 1990, there has also been a 1.1 million metric ton decrease in emissions from coal mines during the same period (Table 13). The 26-percent decline in emissions from coal mining is the result of a fourfold increase in methane recovery from coal mines and a shift in production away from gassy mines. Overall, methane emissions account for about 9 percent of total U.S. greenhouse gas emissions weighted by global warming potential.(25) Methane emissions estimates are more uncertain than carbon dioxide emissions estimates. Methane emissions usually are accidental or incidental to biological processes and may not be metered in any systematic way.(26) Thus, methane emission estimates must often rely on proxy measurements. U.S. anthropogenic methane emissions for 1998 also include preliminary data for several key sources; thus, the overall estimate must be described as preliminary. Emissions from two of these sources, coal mining and oil and gas systems, are almost one-third of all U.S. methane emissions. Coal production data on a mine-by-mine basis will not be available until December 1999. Estimates for emissions and recovery from degasification systems have been scaled to a limited set of data for selected mines obtained as part of EIA's 1605(b) Voluntary Reporting of Greenhouse Gases program. Similarly, large portions of estimated emissions from oil and gas systems in 1998 are scaled to total gas throughput for the year, because detailed industry activity data are not yet available. There are three principal sources of U.S. methane emissions: energy production and consumption, waste management, and agriculture. A fourth source, industrial processes, adds about 0.5 percent to estimated methane emission totals. Emissions from energy sources, representing 35 percent of all U.S. methane emissions (Figure 5), declined by more than 6 percent between 1990 and 1998, largely due to the 1.1 million metric ton drop in emissions from coal mining. Methane emissions from waste management, which account for about one-third of total methane emissions, decreased by more than 11 percent between 1990 and 1998 due to the drop in emissions from landfills. Emissions from agriculture represent about 30 percent of all U.S. methane emissions. Emissions from agriculture have grown by 6.9 percent since 1990, with approximately half the growth associated with increased swine populations and the resultant waste output. The majority of the remaining increase is associated with larger sized cattle, generating more methane emissions from enteric fermentation. Figure 5. U.S. Methane Emissions by Source, 1990 and 1998
Energy Sources U.S. methane emissions from energy sources were estimated at 10.1 million metric tons in 1998, virtually unchanged from 1997 levels and 0.7 million metric tons below the 10.8 million metric tons emitted in 1990. The decline between 1990 and 1998 resulted primarily from lower emissions from coal mines. Emissions from coal mines dropped by 26 percent (1.1 million metric tons) between 1990 and 1998. This decline resulted from the increased capture and use of methane from coal mine degasification systems and a shift in production away from some of the Nation's gassiest mines in Central Appalachia. A decrease of 0.13 million metric tons in estimated emissions from stationary combustion made a smaller contribution to the overall drop in emissions from energy sources. Together, the declines in emissions from coal mining and stationary combustion more than compensated for the increase of 0.57 million metric tons in emissions from the oil and gas system attributed to increasing U.S. consumption of natural gas between 1990 and 1998.
The preliminary estimate of methane emissions from coal mines for 1998 is 3.1 million metric tons (Table 14), a decrease of 0.3 percent from the 1997 level.(27) Coal production at surface mines rose by 4 percent between 1997 and 1998, adding 0.02 million metric tons to emissions. This increase was offset by a 0.04 million metric ton decrease in emissions from ventilation systems in gassy mines, attributed to the continued decrease in the number of gassy mines in operation, which reached a decade low number of 116 in 1998.(28) The final 1997 emissions estimate was revised slightly from the October 1998 edition of Emissions of Greenhouse Gases in the United States. Final production data were just above previously estimated levels, raising estimated 1997 emissions by about 0.01 million metric tons. Between 1990 and 1998, methane emissions from coal mines dropped by more than 26 percent from the 1990 level of 4.26 million metric tons. The decline is attributed to three important trends: (1) methane recovery from active coal mines for use as an energy resource increased from 0.25 million metric tons in 1990 to about 1 million metric tons in 1998; (2) methane drainage from active mines decreased by some 0.1 million metric tons between 1990 and 1998; and (3) methane emissions from ventilation systems at gassy mines dropped by about 0.3 million metric tons between 1990 and 1998 (Table 14).(29) Table 14. U.S. Methane Emissions from Coal Mining and Post-Mining Activities, 1990-1998 Oil and Gas Production, Processing, and Distribution
Methane emissions from U.S. oil and gas systems in 1998 were 6.3 million metric tons (Table 15), up by 0.3 percent from 1997 levels but 10 percent above 1990 levels. Emissions have grown steadily between 1990 and 1998 due to increased production and consumption of natural gas. Between 1990 and 1998, total gas withdrawals grew by 14 percent, gas processed increased by 15 percent, and distribution main pipeline miles rose by 14 percent. Table 15. U.S. Methane Emissions from Oil and Gas Operations, 1990-1998 Just over one-third of the increase in emissions from oil and gas operations between 1990 and 1998 is attributable to emissions from gas production, which grew from 1.47 million metric tons in 1990 to 1.67 million metric tons in 1998. Another third is attributable to gas distribution systems, where emissions rose from 1.36 million metric tons of methane in 1990 to 1.55 million metric tons in 1998. Most of the remaining portion of the emissions escalation can be traced to transmission and storage emissions, which increased by 0.1 million metric tons between 1990 and 1998.(30) Methane emissions from oil wells were level between 1990 and 1998 as the number of wells in operation dropped by 8 percent. Emissions from oil refining and transport rose by more than 13 percent during the period as crude oil imports grew by 45 percent. Stationary Combustion
U.S. methane emissions from stationary combustion in 1998 were 0.4 million metric tons, nearly the same as the 1997 level but 23 percent lower than 1990 levels (Table 16). After remaining relatively stable between 1990 and 1996, residential wood consumption dropped in 1997 and 1998, reaching 26 percent below 1990 levels. Residential wood consumption typically accounts for about 90 percent of methane emissions from stationary combustion. Methane emissions are the result of incomplete combustion, and residential woodstoves and fireplaces provide much less efficient combustion than industrial or utility boilers. Thus, although the residential sector consumes about one-quarter the amount of wood that the industrial sector consumes, emissions from wood consumption for the residential sector are 13 times higher than those for the industrial sector. Table 16. U.S. Methane Emissions from Stationary Combustion Sources, 1990-1998 Estimates of residential wood combustion are, however, very uncertain (see Appendix C). The universe of wood consumers is large and heterogeneous, and wood for residential consumption is typically obtained from sources outside the documented economy. EIA relies on its Residential Energy Consumption Survey (RECS) to estimate residential wood consumption. This survey includes only primary residences and thus systematically underestimates consumption by as much as 5 percent. Beginning in 1998, EIA wood consumption estimates were adjusted to account for wood consumption in second homes.(31) EIA is now in the process of completing a new RECS, which will provide wood consumption data through 1997. Preliminary data from the survey are used for the first time in this year's report. Wood consumption data for the years between the EIA surveys are interpolated and adjusted for variations in heating and cooling degree-days.
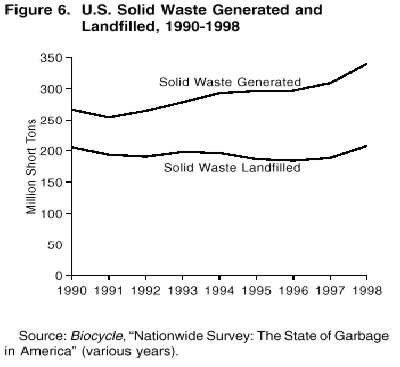
Methane emissions from mobile combustion in 1998 are estimated at 0.24 million metric tons, unchanged from 1997 levels (Table 17). This estimate includes emissions from motor vehicles and other sources. Other sources include air, rail and marine transport, and farm and construction equipment. Currently, methane emissions from passenger cars and light-duty trucks represent more than 82 percent of overall methane emissions from mobile combustion. Table 17. U.S. Methane Emissions from Mobile Sources, 1990-1998 Between 1980 and 1991, methane emissions from mobile sources declined by 15 percent, primarily due to the drop in emissions from passenger cars. Catalytic converters, used on U.S. vehicles to control emissions, have grown more efficient in reducing methane emissions over time. Thus, as the U.S. fleet is replaced, the remaining vehicles have lower emissions profiles than their earlier counterparts. The downward trend in emissions was altered in 1992 as the size of the U.S. fleet of light duty trucks began to rise. Between 1992 and 1998 the number of light-duty trucks rose by 20 percent. Although methane emissions from passenger cars continued to decline from 1992 to 1998, that decrease was more than offset by the sharp rise in emissions from light-duty trucks during the period. Consequently, the share of total methane emissions from mobile sources attributed to light-duty trucks has risen from 27 percent in 1992 to 39 percent in 1998. Although shrinking, emissions from waste management still account for about one-third of U.S. anthropogenic methane emissions. In 1998, estimated emissions from waste management were 9.9 million metric tons, the lowest in two decades (Table 13). Emissions from waste management were 11.1 million metric tons in 1990, about 1.2 million metric tons above the 1998 level. Ninety-eight percent of emissions from waste management are attributed to emissions from landfills. The remainder are associated with domestic wastewater treatment. The landfill share would be lower if more information on emissions from industrial wastewater treatment were available (see Appendix D, "Emissions Sources Excluded"). A diminishing portion of municipal solid waste is landfilled each year as recycling and composting programs expand (Figure 6). Also, increasing amounts of methane are being captured and used as an energy resource or flared to control odor or emissions of other pollutants. These developments have reduced waste management emissions. Figure 6. U.S. Solid Waste Generated and Landfilled, 1990-1998 Landfills
Methane emissions from U.S. landfills in 1998 were an estimated 9.7 million metric tons, their lowest level since the late 1970s. Estimated emissions were 5 percent below 1997 levels and 12 percent below the 1990 level (Table 18). The declines since 1990 and 1997 are almost entirely attributable to increased methane recovery at landfills. Between 1990 and 1997 the volume of municipal waste generated in the United States grew by 16 percent.(32) Meanwhile, the amount of waste reaching landfills and subject to decomposition decreased from 77 percent to 61 percent, primarily due to increased curbside recycling and also to composting. As a result, methane generation from decomposition at landfills grew by just 3 percent between 1990 and 1998. A robust economy, particularly in the housing sector, resulted in a 10-percent increase in waste generation between 1997 and 1998. The percentage of waste reaching landfills was unchanged between 1997 and 1998, leading to increased volumes of waste landfilled in 1998. Because most emissions lag several years behind waste generation, methane generation rates may increase over the next several years. Table 18. U.S. Methane Emissions from Landfills, 1990-1998 The increase in methane recovery from landfills between 1990 and 1998 outstripped the slow growth in methane generated at landfills during that period. The growth in methane recovery for energy probably was caused by the prospective expiration of the Federal Section 29 (of the Internal Revenue Code) tax credit for alternative energy sources. This credit provides a subsidy roughly equivalent to 1 cent per kilowatthour for electricity generated using landfill gas. In order to qualify for the tax credit, gas-to-energy systems were required to be operational by June 30, 1998. There was a rush to get systems on line by the deadline, increasing the number of operational projects from an estimated 150 in 1997 to more than 200 in 1998.(33) According to the EPA's Landfill Methane Outreach Program, there are now more than 280 landfills recovering methane for energy.(34) Between 1997 and 1998, methane recovered for energy rose from 1.7 million metric tons to 2.2 million metric tons. Based on the continued increase in the number of projects, this number can be expected to continue to grow over the next several years. Capture and flaring of landfill gas also increased from 0.3 million metric tons in 1990 to 0.7 million metric tons in 1998. Domestic and Commercial Wastewater Treatment Methane emissions from domestic and commercial wastewater treatment are a function of the share of organic matter in the wastewater stream and the conditions under which it decomposes. Wastewater may be treated aerobically or anaerobically. If it is treated aerobically, methane emissions will be low. Under anaerobic conditions, methane emissions will be high. There is little data available on wastewater treatment methods. Data on flaring or energy recovery from methane generated by wastewater is also sparse. Thus, emissions are scaled to population data. With the U.S. population growing slowly, methane emissions from domestic and commercial wastewater treatment are estimated to have grown by 1 percent between 1997 and 1998 and by about 8 percent since 1990.
Of the approximately 28.8 million metric tons of methane emitted from U.S. anthropogenic sources in 1998, 30 percent (8.7 million metric tons) are attributable to agricultural activities (Table 13). Ninety-four percent of methane emissions from agricultural activities result from livestock management. About two-thirds of this share can be traced to enteric fermentation, the natural digestive process in ruminant animals. The remaining one-third of emissions can be attributed to the anaerobic decomposition of livestock wastes. A small portion of U.S. methane emissions result from crop residue burning and wetland rice cultivation. Estimated agricultural methane emissions increased by 0.06 million metric tons between 1997 and 1998. The 8.7 million metric ton total was 0.6 million metric tons higher than in 1990. Changes in agricultural emissions are caused by changes in the size and composition of animal populations. Cattle populations increased between 1990 and 1994 but have since declined. Thus, emissions from agriculture peaked in 1994. Swine populations rose in 1997 and 1998, contributing to slightly higher emission levels in those years than in 1996. Enteric Fermentation in Domesticated Animals
Methane emissions from enteric fermentation in domesticated animals are estimated at 5.4 million metric tons for 1998, essentially unchanged from estimates for 1997 and 5 percent above 1990 levels (Table 19). After escalating from 1987 through 1994, emissions from enteric fermentation stabilized in 1995 and have since declined to near 1992 levels. Table 19. U.S. Methane Emissions from Enteric Fermentation in Domesticated Animals, 1990-1998 Because cattle account for about 95 percent of all emissions from enteric fermentation, trends in emissions correlate with trends in cattle populations. Between 1990 and 1994, cattle populations grew, but by 1995 they had largely stabilized, and between 1995 and 1998 they decreased. Similarly, average animal size increased between 1990 and 1994 before declining in 1995 and 1996. By 1998, however, average cattle size (excluding reductions in calf size) had risen to an all-time high. On a national average basis, cows are 5.6 percent larger than they were in 1990. Milk production in 1998 also increased from 1996 and 1997 levels.(35) Because animal size and milk production affect energy intake, and methane emissions are a function of energy intake, the decline in emissions associated with decreased cattle populations was mostly offset by the increase in animal size and milk production. A minor contributor to decreased emissions was the slaughter of calves at a younger age. Historical population trends and associated emissions traced back to 1980 yield a cyclical pattern as cattlemen respond to market price signals by increasing and decreasing their herds. The current stage is the middle of a downward cycle. Solid Waste of Domesticated Animals
Methane emissions from the solid waste of domesticated animals are estimated at 2.8 million metric tons in 1998, up slightly from 1997 levels (0.04 million metric tons). Emissions levels remain above the 1990 level of 2.6 million metric tons (Table 20). The 1998 growth in emissions is attributable to large increases in swine waste, particularly from swine bred for market. Methane emissions from swine waste reached their highest levels in 18 years and are an increasingly important source of methane emissions, growing by 13 percent from 1990 levels.(36) In 1998, 49 percent of emissions from the solid waste of domesticated animals were attributable to swine waste, and 43 percent were attributable to cattle waste. Table 20. U.S. Methane Emissions from the Solid Waste of Domesticated Animals, 1990-1998 Populations of swine bred for market grew by 12 percent between 1996 and 1998.(37) Absent the growth in swine populations and given the relatively small fluctuations in cattle populations, emissions levels would have stabilized or shown a slight decline in 1998. About one-half of the increase in emissions not associated with swine waste is the result of increased emissions from dairy cattle waste, which are attributable to a shift in the method used for handling the solid waste of dairy cattle in six States: Arizona, Florida, Nevada, North Carolina, North Dakota, and Texas. Between 1990 and 1994, waste management techniques in those States shifted toward liquid systems, especially anaerobic lagoons. Solid waste managed in anaerobic lagoons(38) realizes a much larger share of its maximum potential methane production than alternative methods. Growing poultry populations also contribute to the growth of emissions.Estimated 1998 methane emissions from rice cultivation were 0.47 million metric tons, up by 5.6 percent from the 0.44 million metric tons estimated for 1997. The 1998 estimate is 15.6 percent higher than the 1990 level due to a 14-percent increase in area harvested. In the estimate of methane emissions from rice cultivation appearing in the previous edition of Emissions of Greenhouse Gases in the United States, 1997 activity data for Florida were unavailable. The estimate in this report now includes 1997 data for Florida, which have also been extrapolated to provide a 1998 estimate. The area of land harvested has increased in 5 out of 7 rice growing States (Arkansas, Texas, Louisiana, Mississippi, and Missouri) compared with 1997 estimates. The area harvested, and thus emissions, rose by 19 percent in Missouri and 12 percent in Mississippi. The total area harvested in 1998 was 6.9 percent greater than in 1997. Burning of Crop ResiduesIn 1998, modest increases in corn, soybean, wheat and sugar beet production accounted for a small increase in methane emissions from the burning of crop residues. Emissions grew to almost 0.042 million metric tons, up by 1 percent from 1997 levels. This total was 10 percent above the 1990 emissions level of 0.038 million metric tons. Crop residue burning, being the smallest contributor to agricultural greenhouse gas emissions, represents on the order of 0.1 percent of total U.S. methane emissions. Inferred methane emissions from crop residue burning are caused by changes in crop production. Overall, 1998 crop production was up by 9 percent from 1997 levels and by 14 percent from 1990 levels. However, because residue from California rice fields is burned at a much higher ratio than residue in other States, it has a disproportionate effect on emissions levels. Emissions from California rice fields decreased steadily from 1990 to 1996 as the share of residue burned declined from 99 percent to 50 percent. From 1996 to the present, the share burned has remained steady at 50 percent (only about 3 percent of crops are assumed to be burned in other States).(39) Crop production in California dropped by 23 percent from 1997 levels due primarily to climatic factors: a cold, wet spring delayed early-season crop development The burning of the California crop represented about 5 percent of total methane emissions from crop residue burning in 1998.
U.S. methane emissions from chemical production in 1998 were 0.077 million metric tons, just 0.002 million metric tons higher than 1997 levels but about 0.02 metric tons higher than 1990 (Table 21). Since 1990, emissions levels have increased along with production levels as a consequence of steady economic growth. Production of ethylene, ethylene dichloride, and styrene all have grown by about 40 percent since 1990. Methanol has experienced the largest growth in production, growing by approximately 50 percent during the same period. Table 21. U.S. Methane Emissions from Industrial Processes, 1990-1998 Estimated methane emissions from iron and steel production in 1998 were 0.056 million metric tons, down by 0.002 million metric tons from 1997 levels and 9 percent below the 1990 level of 0.062 million metric tons (Table 21). This was the third consecutive year of decline, after emissions from iron and steel production grew between 1991 and 1995. The decline in emissions can be traced to a decrease in production of pig iron since 1995. |
|||||||||||||||||||||||||||||||||||||||||||||||||||||||||||||||||||||||||||||||||||||||||||||||||||||||||||||||||||||||||||||||||||||||||||||||||||||||||||||||||||||||||||||||||||||||