Manufacturing, which accounts for 80
percent of industrial energy consumption, also accounts for 80 percent of
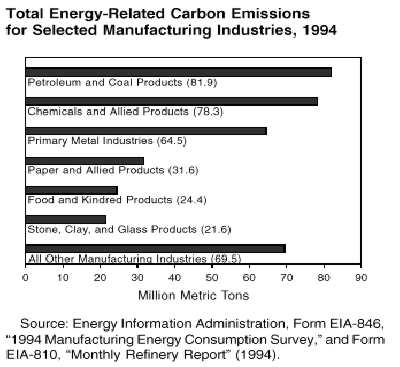
industrial energy-related carbon emissions. In 1994, two industries,
petroleum and chemicals, emitted over 40 percent of the energy-related
carbon in manufacturing. The next four largest emitters (primary metals,
paper, food, and the stone, glass, and clay products industry) produced the
other 40 percent of the energy-related carbon emissions from manufacturing
(see figure).
The carbon intensity of energy use is
the amount of carbon emitted per unit of energy used. Both the mix of energy
sources used and the uses of energy affect carbon intensity. Overall,
manufacturing industries had a carbon intensity of 17.16 million metric tons
per quadrillion Btu in 1994; however, the carbon intensities of the various
industries differed markedly.
The petroleum industry and the
chemical industry both convert energy sources into products, such as
petrochemical feedstocks and plastics (Table 6). Only part of the carbon content is
emitted to the atmosphere, the rest being sequestered in the product (see
Table A2). As a result of the nonfuel use of energy sources, the petroleum
and chemical industries had lower than average carbon intensities in 1994,
12.91 and 14.69 million metric tons per quadrillion Btu, respectively.
Table 6.
U.S. Carbon Sequestered by Nonfuel Use of Energy, 1990-1998
The paper industry uses wood
byproducts extensively, yielding a carbon intensity of 11.87 million metric
tons per quadrillion Btu in 1994. The carbon emissions from wood combustion
are considered to be zero, because the carbon emitted has been recently
sequestered and the regrowing of the trees will resequester the emitted
carbon. In contrast, the primary metals industry relies heavily on coal and,
to a lesser extent, on electricity (much of which is generated using coal).
Both coal and electricity are carbon-intensive fuels, resulting in an
overall carbon intensity of 26.19 million metric tons per quadrillion Btu
for this industry in 1994.
The food industry and the stone,
metal, and glass industry both had carbon intensities that were slightly
above the average for all manufacturing industries. However, the carbon
intensities for these two industries, and for the primary metals industry,
were comparable to those for "All Other Manufacturing Industries"
(25.45 million metric tons per quadrillion Btu).
Electricity use is the main source of
carbon emissions in industries outside the top six emitters of carbon. Other
manufacturing includes industries such as textile mill products, furniture
and fixtures, leather and leather products, fabricated metal products,
industrial machinery, and electric and electronic products. Their collective
carbon intensity was 25.45 million metric tons per quadrillion Btu in 1994.