|
Report Contents Report#:EIA/DOE-0573(98)
Related Links |
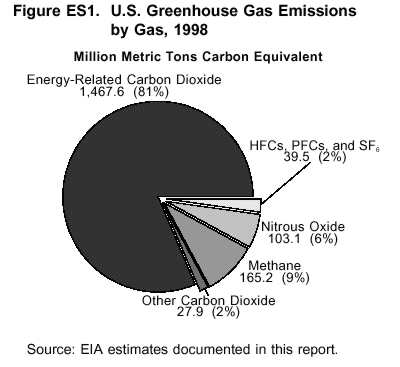
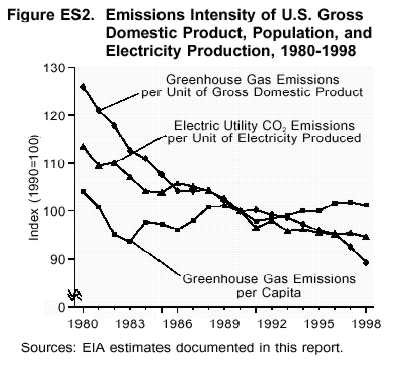
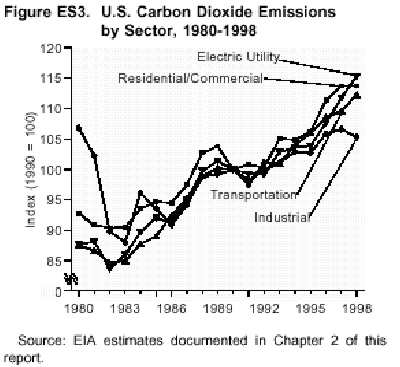
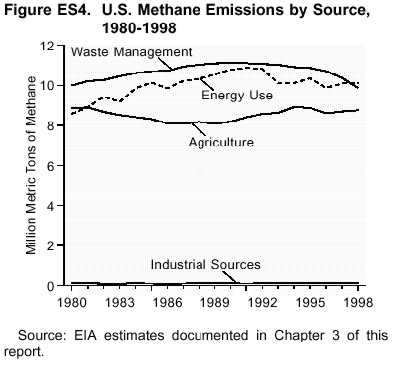
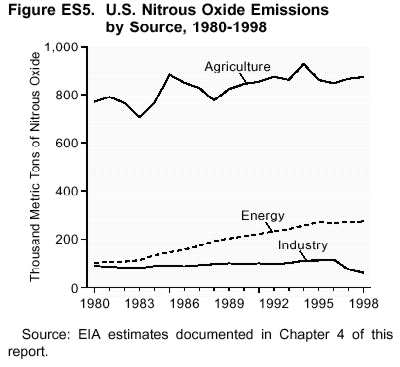
Introduction Total U.S. emissions of greenhouse gases in 1998 increased by 0.2 percent from their 1997 level, below the average growth rate of the 1990s (1.2 percent). During 1998, crude oil prices dropped by one-third and the U.S. economy expanded at a 3.9-percent annual rate. The slowing of growth in emissions resulted in part from a much warmer-than-usual winter in 1998 and in part from lower emissions from the industrial sector. Overall, 1998 U.S. greenhouse gas emissions were about 10 percent higher than 1990 emissions. Since 1990, U.S. emissions have increased at an annual rate of 1.2 percent, slightly faster than population (1.1 percent) but more slowly than energy consumption (1.4 percent), electricity consumption (2.2 percent), or gross domestic product (GDP) (2.6 percent). Table ES1 shows trends in emissions of the principal greenhouse gases, measured in million metric tons of gas. In Table ES2, the value shown for each gas is weighted by its global warming potential (GWP), which is a measure of "radiative forcing." This concept, developed by the Intergovernmental Panel on Climate Change (IPCC), provides a comparative measure of the impacts of different greenhouse gases on global warming, with the effect of carbon dioxide being equal to one.(1) Table ES1. U.S. Emissions of Greenhouse Gases by Gas, 1990-1998 Table ES2. U.S. Emissions of Greenhouse Gases, Based on Global Warming Potential, 1990-1998 During 1998, some 81 percent of U.S. greenhouse gas emissions resulted from the combustion of fossil fuels such as coal, petroleum, and natural gas. Consequently, U.S. emissions trends are largely caused by trends in energy consumption. In recent years, national energy consumption, like emissions, has grown relatively slowly, with year-to-year fluctuations caused by weather-related phenomena, business cycle fluctuations, and developments in domestic and international energy markets. Other 1998 U.S. emissions include carbon dioxide from noncombustion sources (2 percent of total U.S. greenhouse gas emissions), methane (9 percent), nitrous oxide (6 percent), and other gases (2 percent) (Figure ES1). Methane and nitrous oxide emissions are caused by the biological decomposition of various waste streams and fertilizer, fugitive emissions from chemical processes, fossil fuel production and combustion, and many smaller sources. The other gases include hydrofluorocarbons (HFCs), used primarily as refrigerants, perfluorocarbons (PFCs), released as fugitive emissions from aluminum smelting and also used in semiconductor manufacture, and sulfur hexafluoride (SF6), used as an insulator in utility-scale electrical equipment. Figure ES1. U.S. Greenhouse Gas Emissions by Gas, 1998 The Kyoto Protocol, drafted in December 1997, raised the public profile of climate change issues in the United States in general, and of emissions estimates in particular. Emissions inventories are the yardstick by which success or failure in complying with the Kyoto Protocol and the Framework Convention on Climate Change would be measured. This report, required by Section 1605(a) of the Energy Policy Act of 1992, provides estimates of U.S. emissions of greenhouse gases, as well as information on the methods used to develop the estimates. Carbon dioxide accounts for 83 percent of 1998 U.S. greenhouse gas emissions. In 1998, carbon dioxide emissions increased by 0.3 percent, compared with 1997. Figure ES2 illustrates some recent U.S. trends in emissions and energy consumption. Emissions per dollar of GDP and emissions per capita are approximate measures of the carbon intensity of the use of energy services. U.S. emissions per capita, which declined in the early 1980s, have risen in the 1990s, although at a relatively low rate. Emissions per dollar of GDP have declined almost every year. During the early 1990s, several unrelated factors combined to lower the carbon intensity of power generation, including improved nuclear power plant operating rates and the expansion of natural-gas-fired generation caused by relatively low natural gas prices. However, nuclear output has stabilized since 1995, and fossil fuels have supplied most of the incremental growth in generation. Figure ES3 illustrates trends in carbon dioxide emissions by energy consumption sector. Emissions from the industrial sector dropped by 12 percent between 1980 and 1985 as higher energy prices and a severe recession reduced output and induced industry to adopt energy-efficient technologies. Emissions from other sectors also declined in the early 1980s. In the late 1980s, however, emissions rose consistently as energy prices declined in the wake of the 1986 disintegration of OPEC's oil pricing regime. Higher oil prices in 1990, caused by the invasion of Kuwait and a subsequent recession, reduced national emissions by 1.1 percent in 1991. Industrial sector carbon dioxide emissions, which are relatively sensitive to economic fluctuations, declined by 2.5 percent in 1991. During 1991-1997, emissions grew consistently in most sectors, with the largest increases in the transportation and electric utility sectors. Figure ES3. U.S. Carbon Dioxide Emissions by Sector, 1980-1998 In 1998, emissions from the electric utility sector grew somewhat more rapidly (3.2 percent) than the 1991-1997 average (2.0 percent), particularly in the residential and commercial sectors (3.7 percent). Summer air conditioning usage was stimulated by weather that was 14 percent warmer than average and 22 percent warmer than in 1997. Also, very low oil prices stimulated large-scale fuel switching in the electric utility sector from natural gas to residual oil. Oil consumption in the electric utility sector expanded by 42 percent in 1998, raising the average carbon intensity of electricity generation. Warmer winter weather (13 percent warmer than in 1997) reduced consumption of winter heating fuels, particularly natural gas. Overall, carbon dioxide emissions in the residential and commercial sectors (which account for about 35 percent of total emissions) in 1998 remained at their 1997 level. In the industrial sector, energy-related carbon dioxide emissions declined by 1.3 percent in 1998 compared with 1997. Industrial energy consumption historically has been more sensitive to economic growth than to the weather, and 1998 was a year of rapid economic growth. Industrial energy consumption and emissions are concentrated in a few industries, however, and their performance may have more influence on emissions than does the performance of the industrial sector as a whole. Two industrial groupings, chemicals and petroleum refining, account for 54 percent of manufacturing energy consumption. Four more groupings (food, primary metals, stone clay, and glass, pulp and paper) account for another 34 percent of manufacturing energy consumption.(2) Trade association data suggest that direct fuel use in the steel and chemical industries declined.(3) U.S. automobile production also declined in 1998, largely because of a strike at General Motors. Emissions in the transportation sector expanded by 2.4 percent in 1998 compared with 1997. Gasoline consumption, which accounted for 63 percent of transportation sector emissions, grew by 2.8 percent. Emissions from jet fuel grew more slowly (1.5 percent), and reported emissions from residual fuel (used mostly by oceangoing ships) actually declined by 3.8 percent. Emissions from distillate use increased by 3.7 percent, as a healthy U.S. economy led to greater consumption of diesel fuel by freight trucks. U.S. methane emissions declined by 1.4 percent in 1998 compared with 1997, to 28.8 million metric tons of methane (165 million metric tons of carbon equivalent). The decline resulted from an increase in landfill gas recovery operations, spurred in part by the implementation of controls in response to U.S. Environmental Protection Agency (EPA) regulations. In addition, operators were trying to meet a legal deadline for receiving tax credits for landfill methane recovery projects.(4) Because methane accounts for 9.2 percent of U.S. GWP-weighted greenhouse gas emissions, a 1.8-percent decline in methane emissions is equivalent to a 0.2-percent decline in total emissions. Methane emissions come from four categories of sources, three major and one minor. The major sources are energy, waste management, and agriculture, and the minor source is industrial processes. The three major sources accounted for 35, 34, and 31 percent, respectively, of total 1998 U.S. emissions of methane, or approximately 3 percent of the Nation's total greenhouse gas emissions. The largest of the three major sources was energy, followed by waste management (Figure ES4). Emissions from the anaerobic decomposition of municipal solid waste in landfills, part of the waste management source category, had been declining slowly before 1998 as a consequence of a reduction in the volume of waste landfilled and a gradual increase in the volumes of landfill gas captured. Emissions of methane resulting from waste management declined by 4.9 percent in 1998. Figure ES4. U.S. Methane Emissions by Source, 1980-1998 Methane is also emitted as a byproduct of fossil energy production and transport. Methane can leak from natural gas production and distribution systems and is also emitted during coal production. Energy-related methane emissions were virtually unchanged in 1998. Agricultural emissions have several sources but are dominated by emissions from domestic livestock, including the animals themselves and the anaerobic decomposition of their waste. Agricultural emissions increased by about 0.6 percent in 1998. Methane emissions estimates are more uncertain than those for carbon dioxide. U.S. methane emissions do not necessarily increase with growth in energy consumption or the economy. Energy-related methane emissions are strongly influenced by coal production from a relatively restricted number of mines; agricultural emissions are influenced in part by the public's consumption of milk and beef and in part by animal husbandry practices; and livestock and municipal waste emissions are influenced by husbandry and waste management practices. U.S. nitrous oxide emissions declined by 0.5 percent in 1998 compared with 1997, from 104 million metric tons carbon equivalent to 103 million. Nitrous oxide accounts for 6 percent of U.S. GWP-weighted greenhouse gas emissions. Emissions estimates for nitrous oxide are more uncertain than those for either carbon dioxide or methane. The nitrous oxide emissions estimates appearing in this report have been revised upward from last year's report by about 21 percent following the complete implementation of changes in estimation methods recommended by the 1996 revised guidelines of the Intergovernmental Panel on Climate Change. U.S. nitrous oxide emissions include one large class of sources and two small classes (Figure ES5). Agricultural sources account for about 71 percent of nitrous oxide emissions. Emissions associated with nitrogen fertilization of soils account for about three-quarters of agricultural emissions. Emissions associated with fossil fuel use account for another 22 percent of nitrous oxide emissions, of which about 82 percent comes from mobile sources, principally motor vehicles equipped with catalytic converters. The balance of nitrous oxide emissions are caused by certain chemical manufacturing and wastewater treatment processes. Figure ES5. U.S. Nitrous Oxide Emissions by Source, 1980-1998 In 1998, estimated emissions from nitrogen fertilization of soils continued to rise slowly. However, the most striking development has been a 50-percent decline from 1996 levels of industrial emissions of nitrous oxide after the implementation of emissions controls at an adipic acid plant operated by the DuPont Corporation.
The Kyoto Protocol specifies that emissions of several classes of engineered gases--HFCs, PFCs, and sulfur hexafluoride--be limited. Emissions of these three classes of gases account for about 2 percent of U.S. GWP-weighted emissions and are estimated to have increased by about 3 percent in 1998 compared with 1997, a slower rate of growth than in previous years. The slower growth probably is attributable to maturing markets for chlorofluorocarbon substitutes, stagnant markets for key high-GWP gases, and increasing awareness of the potential for recycling these gases. Emissions of the high-GWP gases specified in the Kyoto Protocol are very small (at most a few thousand metric tons). On the other hand, many of the gases have atmospheric lifetimes measured in the hundreds or thousands of years, and consequently they are potent greenhouse gases with global warming potentials hundreds or thousands of times higher than that of carbon dioxide per unit of molecular weight. There are several other categories of chemicals that also qualify as greenhouse gases but are excluded from the Framework Convention on Climate Change and the Kyoto Protocol because they are already controlled under the Montreal Protocol on Ozone-Depleting Substances. They include chlorofluorocarbons (CFCs), hydrochlorofluorocarbons (HCFCs), and several solvents. This report includes estimates of emissions of these gases for completeness. In addition, there are several gases that influence climate indirectly because they promote the formation of ozone, which is itself a greenhouse gas. These gases, already regulated in the United States as urban air pollutants, are sometimes called "criteria pollutants." Criteria pollutants that promote ozone formation are carbon monoxide, nitrogen oxides, and nonmethane volatile organic compounds (NMVOCs). Estimates of emissions of these gases, provided by the EPA, are also included for completeness. Forest lands in the United States are net absorbers of carbon dioxide from the atmosphere. According to U.S. Forest Service researchers, U.S. forest land absorbs about 209 million metric tons of carbon, equivalent to almost 14 percent of U.S. carbon dioxide emissions. Absorption is enabled by the reversal of the extensive deforestation of the United States that occurred in the late 19th and early 20th centuries. Since then, millions of acres of formerly cultivated land have been abandoned and have returned to forest. The regrowth of forests is sequestering carbon on a large scale. The process is steadily diminishing, however, because the rate at which forests absorb carbon slows as the trees mature. The extent to which carbon sequestration should be included in emissions inventories generally, and the extent to which sequestration would "count" under the Kyoto Protocol, are still being determined. The Kyoto Protocol specifically limits "countable" effects for countries like the United States to anthropogenic afforestation, deforestation, and reforestation that have occurred "since 1990" and only if they are "measurable and verifiable." These clauses may tend to limit the applicability of carbon sequestered as a result of land use changes and forestry. In the past 2 years there has been increasing interest in the United States in carbon sequestration in agricultural soils through changes in agricultural practices. Proponents suggest that changes in tillage practices can cause agricultural soils to move from being net sources to net sinks of carbon dioxide, and that the amounts of carbon that might be absorbed by these changes could be significant at the national level. At present, EIA does not have sufficient information to permit reliable estimation of national-level emissions or sequestration from this source. As more information becomes available, soil carbon estimates will be included in future reports. |
