The author of this chapter is Robert Lowe, Renewable Industry Specialist, Energy Information Administration.
This edition of the Renewable Energy Annual updates data on energy production from wood pellets and fuel ethanol. In addition, it features a profile of the U.S. forest products industry and reports on some of the industry�s energy characteristics. Some of the data on the use of wood for energy production that were reported in the Renewable Energy Annual 1995 are not updated in this report. Those data are based on 3- and 5-year surveys, whose cycles will not be completed until 1997. The surveys include the Energy Information Administration�s �Manufacturing Energy Consumption Survey� and �Residential Energy Consumption Survey,� as well as several statistical tables from the U.S. Forest Service data publication, Forest Resources of the United States.
Table 6 provides 1994-1995 and 1995-1996 updates for the data on wood pellet fuel reported in Table 25 of the Renewable Energy Annual 1995. Wood pellets, manufactured from finely ground wood fiber, represent a fast-growing biomass fuel market. Wood pellets are typically 1/4 to 5/16 inch in diameter and about 3/4 inch in length, weighing more than 40 pounds per cubic foot. They are generally sold in 40-pound bags through stove suppliers, feed and seed stores, and home centers for use in pellet stoves.
| Table 6. Regional Distribution of
Pellet Fuel Shipments, 1992-1996 (Tons) |
|||||
| Region | 1992-1993 | 1993-1994 | 1994-1995 | 1995-1996 | Change from 1993-1994 (Percent) |
| Northeast | 35,000 | 62,000 | 84,000 | 107,000 | 73 |
| Southeast | 16,000 | 21,000 | 34,000 | 39,000 | 86 |
| Great Lakes | 11,000 | 26,000 | 24,000 | 36,000 | 38 |
| Central | 21,000 | 18,000 | 15,000 | 19,000 | 6 |
| Mountain | 145,000 | 130,000 | 120,000 | 123,000 | -5 |
| Pacific | 198,000 | 239,000 | 293,000 | 262,000 | 10 |
| U.S. Total | 426,000 | 496,000 | 570,000 | 586,000 | 18 |
| Energy Yield (trillion Btu)a | 7 | 8 | 10 | 10 | � |
| aAssuming an average energy yield
of 17 million Btu per ton. Note: The annual season runs from April 1 through March 31. Source: Personal communication with and facsimile from Leslie Wheeler, Pellet Fuels Institute, Arlington, VA, December 19, 1996. |
|||||
U.S. production of pellet fuel has increased significantly from the 1993-1994 levels reported in the Renewable Energy Annual 1995. According to the Pellet Fuels Institute [12], there are currently 63 pellet manufacturers in North America, and U.S. shipments have increased by 18 percent since the 1993-1994 heating season, despite an 11-percent decline in 1995-1996 from the previous heating season due to warmer weather in Washington, Oregon, and California (Pacific region). The West (Pacific and Mountain regions) continues to dominate pellet fuel sales, consuming 66 percent of U.S. shipments in the 1995-1996 heating season.
Sales of pellet stoves continue to be good, and the industry is expected to grow in the near term, based on the following factors:
Total heat energy produced by pellet stoves in 1995-1996 was approximately 10 trillion Btu, equivalent to 1.7 million barrels of crude oil.
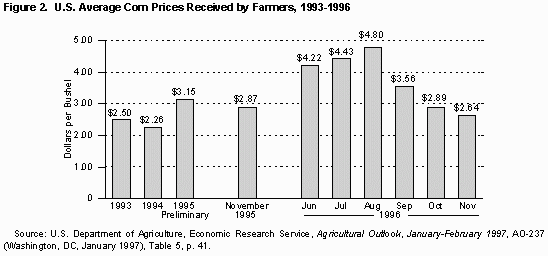
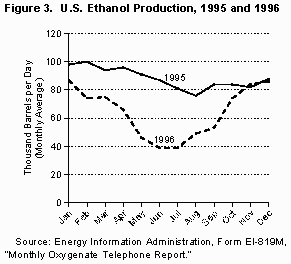
Corn is the primary feedstock used by the majority of U.S. fuel ethanol producers. Late planting in 1996 due to wet conditions resulted in late corn crop development and higher market prices (Figure 2). Ethanol production dropped sharply in mid-1996 (Figure 3). Net plant output was reduced because of short corn supplies and higher prices, and at some plants with the capability to do so, capacity was reallocated to other products. Production output began to increase toward the end of the growing season and reached a level comparable to December 1995 by year�s end. In the corn market, over 95 percent of the crop had been harvested by early December, stocks had been replenished, and prices declined from their earlier highs [13].
|
 |
In contrast to the spring, weather conditions were reported to be nearly ideal in the Corn Belt in the latter part of the 1996 growing season. The U.S. Department of Agriculture expects corn prices to average in the range of $2.50 to $2.80 per bushel during the 1996-97 season, compared with an average of $3.24 per bushel during the 1995-96 season [14].
For the year, net fuel ethanol production in 1996 [15] was dramatically lower than in 1995, amounting only to about three-fourths of the 1995 industry output of about 1.34 billion gallons (101.6 trillion Btu at Lower Heating Value) [16]. However, 1996 ethanol production will still be close to 1 billion gallons, with an approximate energy equivalence of about 75 trillion Btu. According to the Department of Agriculture [17], the 1996-97 corn growing season is expected to be the third largest on record. This prospect is favorable for the fuel ethanol industry.
A separate but pivotal issue for the ethanol industry is the proposed reexamination of the Federal Motor Fuels Excise Tax exemption for gasohol by the 105th Congress. Favorable policy factors, such as contribution to employment and coproduct exports, are frequently cited by proponents of ethanol; however, claims have been made both for and against a positive net energy balance in ethanol production. A recent study by the Department of Agriculture estimated the energy balance associated with ethanol, including all aspects of crop and fuel production. The study found a weighted average net energy ratio (on a Btu per gallon basis) for corn-based ethanol of 1.24, indicating that ethanol replaces petroleum imports at a ratio of 7 to 1 [18].
The forest products industry is a large and important sector of American manufacturing. The pulp and paper subgroup of the forest products industry accounts for about two-thirds of the sector�s manufacturing output. The pulp and paper industry (SIC designation �Paper and Allied Products�), considered by itself, is the tenth-largest manufacturing group in American industry [19]. The forest products industry is populated by numerous electric power generators that use and sell steam and electricity. It is the largest self-generator of energy in American manufacturing, despite being only the third-largest consumer of electrical energy.
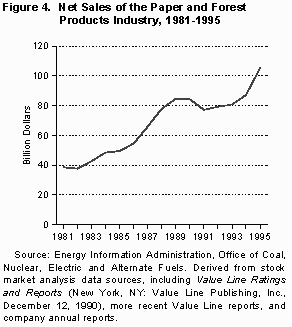 |
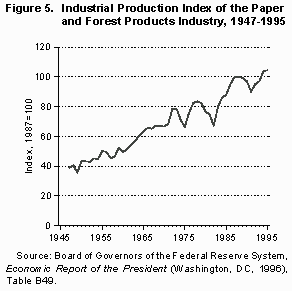
The present report compiled a 15-year profile of the 25 largest paper and forest manufacturing companies, based on investment information sources and the annual reports of individual companies [20]. Total net sales of this industry segment grew from around $40 billion in 1981 to about $105 billion in 1995 (Figure 4). Figure 5 illustrates the economic performance of the forest products industry (i.e., buildings, furniture, etc.) beginning in 1947 and indexed to 1987 sales.
The forest products industry comprises, at one end of the scale, a multitude of small and medium-sized businesses and, at the other, about two dozen extremely large international corporations. Some of these are conglomerates, also doing business in such enterprises as container manufacturing, chemicals, real estate, financial services, automotive components, and many other businesses. The American Forest & Paper Association (AFPA) reports total industry employment of approximately 1.4 million people and total production valued at more than $200 billion a year (see box below) [21]. In addition to their U.S. operations, many of these companies maintain Canadian subsidiaries, timber holdings, and leases. Net sales of a few of these companies exceed $10 billion per year. Several forest product companies owned and headquartered in Canada are not included in this report. Nevertheless, the industry is to a large extent North American in character and is frequently treated as such by market behavior models [22].
 |
It is not uncommon for large American forest and paper companies to maintain both joint and wholly-owned plant operations and timber resources in foreign countries, located in almost any temperate or tropical part of the world. Several companies report wholly-owned or joint-venture facilities and plantations in Latin America [23]. Plantations are located in Brazil, New Zealand, and other forested areas of the world. Eucalyptus is a hardwood, for instance, imported into the United States for wood products and chemicals or feedstocks. Quite a few U.S. companies maintain overseas sales offices in Europe and Asia. Some report strong market shares in finished goods in these areas (although sales have declined in some cases with unfavorable local economic conditions). U.S. products are sometimes exported under original brand names, or they may bear regionally adopted foreign labels. The products are sometimes physically modified to the taste and needs of destination markets. The current profile includes only U.S.-based companies; however, statistics, as reflected in Figure 5, are based on total corporate activity, which includes foreign sales.
The American Forest & Paper Association estimates
that the forest products industry in the United States, the largest in
the world:
The average single-family American home is about 2,000 square feet in size and can contain on the order of 16,900 board feet of lumber and up to 10,000 square feet of panel products. Source: American Forest & Paper Association, Quick Facts About America�s Forest & Paper Industry (Washington, DC, Summer 1995). |
The population of businesses in the U.S. forest products industry numbers from as many as several hundred in some States to more than a thousand in a few. Even though comprehensive survey-based data are not available from which a complete picture of the small and medium business segment of the industry can be drawn, an approximation of their combined market strength can be found in the arithmetic difference between the AFPA estimate of total industry sales and the sales of the subgroup of the largest companies. This exercise indicates that the recent annual product output of the small and medium segment is in the neighborhood of $100 billion, or nearly as large in aggregate as the combined sales of the 25 largest corporations. This is an important factor, which is reflected in the broad employment and diverse company characteristics of the forest products industry, as compared with those of more monolithic industries.
Many very large companies, in spite of�or because of�their size, are not completely self-sufficient in their fiber and timber needs. As a result, they represent a large, although sometimes cyclical [24], market for other companies, both within their own classification and smaller. It is sometimes in the self-interest of forest product businesses of all sizes to specialize, differentiate their products in some economically favorable way, or tailor their production to niche markets, and they frequently do so. The result is remarkable in that, while forest product companies share many common characteristics, they often have a variety of distinct �personalities� probably not found in less diverse industries [25].
Some industry subgroups and corporate divisions are involved in the supply of basic commodities such as rough lumber or the wood chips used for pulpwood or boiler fuel. Sawmill and chip mills are examples. Other industry subgroups and corporate divisions operate plants that deal in value-added products such as refined commodities and finished products. Examples of the products they make include dimension lumber, flooring, sheet stock (i.e., plywood and particle board), newsprint, and wood pulp.
The diversity of the forest products industry is reflected in its wide range of manufacturing specialization. One of many possible examples is �chip-n-saw� mills, which provide a market for trees larger than those usually ground into pulpwood but too small for saw timber. These mills process timber from trees that measure between 6 and 14 inches in diameter by removing the rounded outer layer of a log, then sawing the remaining rectangular inner section into lumber [26].
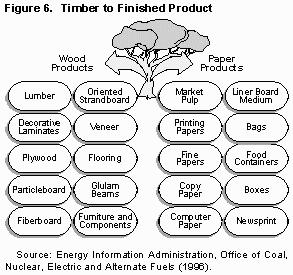
Wood pulp, an example of a commodity product manufactured by the paper industry, may be used by a company�s downline manufacturing operations or sold to others, referred to as �converters.� Wood pulp varies in finished moisture content and can be repulped or directly processed. Converters manufacture a vast array of products from more basic paper products, including finished and coated papers, envelopes, shipping cartons, food containers, and paper bags. In almost analogous fashion, saw logs and dimension lumber are made into a large variety of structural components, building materials, furniture, and wood components. Forest residues, sawdust, mill scraps, and waste are likewise used for these purposes. Figure 6 illustrates the transformation of raw wood by manufacturing to a few of the thousands of finished wood products.
 |
Forest product companies are active not only in all the manufacturing operations illustrated in Figure 6 but in hundreds of others as well. These processes have specialized energy requirements, and some produce as well as consume energy. The nature of wood energy generation and consumption in the forest products industry is integrally linked to the characteristics of these operational processes. There is a close relationship between rate of utilization of wood and residues for energy and plant output levels. Consequently, changes in basic processes or in the kinds of products manufactured may affect wood and wood byproduct fuel consumption [27]. Several factors, discussed below, have historically affected supply, demand, and energy consumption and generation. These are only a few of the many aspects of this complex and diverse industry and do not compose a comprehensive list of factors.
There is evidence that a fair amount of differentiation, specialization, acquisition, and divestiture has taken place in the forest products industry over the past decade. Some of these actions are a result of corporate strategies to avoid or ameliorate the effects of oversupply or undersupply of timber and wood commodities for companies that are buyers, or to lessen the pain of low product prices during unfavorable market conditions for companies that are sellers.
Wood shortages have occurred due to factors such as constriction of available timber supply for environmental reasons; oversupply has occurred for reasons such as increased exports from other countries and peaking production related to capital investment cycles (discussed below). In general, commodity wood product price levels closely track these factors. However, there are indicators that fuelwood price and availability are not as directly affected by them as they are by the general market.
Today, extensive manufacture of recycled-content paper and wood products make recovered paper an important component of fiber supply (see box below). A waste industry poll of State recycling programs indicates that recycled-content office paper is the most widely purchased recycled product. State-mandated content levels range from 8 percent to 50 percent [28].
Company strategies for coping with fiber supply shortages have included:
According to the American Forest & Paper
Association:
Source: American Forest & Paper Association, Quick Facts About America�s Forest & Paper Industry (Washington, DC, Summer 1995). |
Wiildfires were a serious problem during 1996. The National Interagency Fire Center in Boise, Idaho, reported that by September 1996, 85,313 wildfires had destroyed about 5.4 million acres of brush and forest land, mainly in the West and Alaska�more than 2.5 times the 5-year average of nearly 2 million acres a year [33]. The effect on fiber supply is not yet known.
Fiber supply situations also extend to recycled [34] wood and paper commodities and products. Broad fluctuations in price and supply have occurred at times. Periods of serious oversupply have been reported for several varieties of recovered raw materials during the past 5 years, resulting in some business failures. An undersupply condition occurred, however, between June 1994 and May 1995, affecting old corrugated containers and double-lined kraft, which are used heavily by mills that produce recycled paperboard. Their costs increased during the period from $85 to $110 per ton and from $195 to $270 per ton, respectively. In order to ensure a steady source of supply, at least one paperboard manufacturer acquired several recycling centers [35].
Historically, the paper and allied products manufacturing group, composing about two-thirds of the forest products industry, has been highly capital-intensive. The AFPA reports that the ratio of investment in plant and equipment to employment is $100,000 per employee, over twice that of overall U.S. manufacturing [36]. Profits of many companies are lean during poor economic conditions and more profitable during, or slightly after, periods of a healthy economy. Increased capital investment activity often follows on the heels of profitability. Then, as capital improvements come on line, industry manufacturing capacity and output begin to increase, and oversupply of commodity products may sometimes occur. Low profitability may then result from market gluts.
The same effect has resulted from the intersection of unfavorable market forces. The following is an example. Newsprint manufacturers built new plants during the 1980s in response to growing demand for paper with more recycled content. As new mill production peaked in the early 1990s, global economic growth declined. Prices for newsprint fell drastically from the late 1980s, as newspaper companies adjusted product output, until turning around and nearly doubling by 1995 [37].
In its analysis supporting the National Wood Energy Model (NAWEM), the U.S. Forest Service states that many traditional wood energy supply sources are not used in the production of timber products, such as saw logs, veneer logs, or pulpwood [38]. Much available wood energy supply is derived from �nongrowing� timber stock, i.e., �slash� and wood waste recovered from other sources. Therefore, demand for woodfuel does not compete directly with demand for lumber, panels, and paper, which are derived primarily from commercial timber (see also Chapter 6 of the Renewable Energy Annual 1995 for a discussion of wood residue supply sources). The model also considers that demand for woodfuel may be slow to respond to changes in wood energy or fossil fuel prices [39].
Other factors supporting this market behavior are as follows:
Electricity and thermal energy (in the form of direct heat, hot air, hot water, and steam) are consumed in large quantities by forest product processes. Electricity is required in large quantities to power motors which drive process machinery, pumps, air compressors, hydraulic systems, and handling systems, including saws, planers, edgers, joiners, knives, conveyors, extruders, printing and forming, presses, and railed platforms.
Current papermaking technology uses either chemical or mechanical processes, or both. In either process, cell fibers are separated (delignified) in manufacturing pulp. The cell structure partially collapses in delignification, and the resulting fiber particles are further processed and formed into paper. The recent manufacturing trend is toward utilization of mechanical processes. A comparison of the characteristics of each process follows [42]:
|
Mechanical |
Chemical |
Mechanical pulping requires a greater expenditure of energy than chemical pulping and does not generate black liquor, a byproduct that can be burned for energy (except when it is produced by chemical pretreatment). Some energy is required by chemical processes, however, to recover pulping liquor, thereby subtracting from net energy produced by the system. As a precondition to combustion in such boiler systems, pulping liquor is �dewatered� to achieve a near-solid combustible state.
After delignification, the pulp is bleached to eliminate impurities and achieve brightness in some paper products. This is required for white paper products and high-grade paper and packaging. The most common bleaching processes used traditionally in papermaking employ chlorine. Newsprint, unbleached paperboard, and other lower grade products do not require bleaching. Energy is expended in the recovery of pulping and bleaching chemicals and the cleanup of waste water.
AFPA data show woodfuel use by the pulp and paper industry at a plateau of just under 400 trillion Btu per year for the last decade. At the same time, energy from pulping liquor has climbed steadily to a current level of about 1.1 trillion Btu [43]. Several conditions may account for this consumption pattern:
To the extent that mechanical pulping may increase in prevalence, byproduct generation and consumption of pulping liquor could be expected to decrease. Another chemical method, sulfite pulping, leaves residual lignin in the finished product. A new technology, �biopulping,� shows great environmental promise. The pretreatment of wood chips with the wood-reducing fungus associated with biopulping has reduced residual lignin in sulfite pulping by 50 percent (by conversion to cellulose) in research-scale projects [45]. Lignin converted to cellulose in this process becomes usable pulp and is not available as a combustible byproduct; however, the process reduces the electricity requirement by up to 43 percent.
Other factors in the forest products industry at large can increase energy yield relative to a given woodfuel consumption rate. These include combustion system (refractory and boiler) improvements or upgrades, use of heat exchangers to capture residual process and boiler heat, and use of waste heat for drying wood raw material and woodfuel.
It has been stated that wood products compose 47 percent of the industrial raw materials made in the United States, while they consume only 4 percent of manufacturing energy [46]. Wood products can be classified into five very rough, primary groups: sawed lumber, glued engineered wood products, pulpwood, fuelwood, and other products. The first three of these are manufactured by sawmills; plywood, particle, and strand product mills; and pulp, paper, and paperboard mills. Some of the energy characteristics of these mills are discussed below.
Table 7 shows the energy and raw material input of a modern sawmill. Representative energy values for the fuel products generated by this hypothetical sawmill are given in the footnotes of the table and adjusted to a 12-percent wet basis moisture content to enable an approximate comparison to the one oven-dry ton of input wood. If the energy values of the fuel products are then added, it can be seen that the total exceeds the energy used by the sawmill by about 10 percent. If the sawdust in the �Products� column of the table were used [47], the value of the fuel products produced by the sawmill would exceed that consumed in its operation by nearly 30 percent.
| Table 7. Energy and Raw Materials Inputs and Outputs of a Modern Sawmill | ||
| Initial Inputs | Products | Components of Fuel Output |
| 1 oven-dry ton of wood 113 kilowatthours of electricity (2.25 million Btu equivalent) |
0.56 ton lumber 0.25 ton pulp chips 0.15 ton fuel 0.04 ton sawdust |
0.10 ton barka 0.03 ton endsb 0.02 tons sanderdustc |
| a4,418 Btu per pound at 50 percent
wet basis moisture content, based on American Forest & Paper Institute
1994 data, or 16,664,000 Btu per ton adjusted to 12 percent wet basis (approximate
equilibrium) moisture content. Oven-dry moisture level is in the range
of about 0 percent to equilibrium level. b4,166 Btu per pound at 50 percent wet basis moisture content, based on American Forest & Paper Institute 1994 data for hogged fuel, or 15,551,360 Btu per ton adjusted to 12 percent wet basis (approximate equilibrium) moisture content. Oven-dry moisture level is in the range of about 0 percent to equilibrium level. cApproximately 8,700 Btu per pound on an oven-dry basis for an average of 12 common commercial tree species. Source: Based on D.A. Tillman, The Combustion of Solid Fuels and Wastes (New York, NY: Academic Press, 1991), pp. 48-50. |
||
Plywood, particle board, strand board, and laminated beams are manufactured in the engineered wood product industry. Plywood is made by sandwiching veneered wood sheets together with glue and forming the resulting panel to dimension specifications under heat and pressure. Strand board and particle board are made by forming strands of wood fiber or particles with adhesives under heat and pressure. Drying operations are by far the most energy-intensive aspect of panel manufacturing. In some processes, wood or wood fibers must be dried to an acceptable level in order for the adhesive to bond to them properly. In other processes, such as conveyor drying of strand board panels, heat is applied for the purpose of both forming and driving moisture out of the panel.
Glued, laminated beams, or �glulams,� are air-cured and require no process energy in manufacture other than when radiofrequency energy is applied to set connectors and end plates into the components. This is a low-energy process and represents only a minor energy consumption factor. The engineered wood product industry uses waste wood from timber processing and mill scraps from manufacturing extensively to produce much of the energy used in drying and other processes. This industry has realized significant energy savings in recent years through modernization programs that have minimized material waste, improved process control, and upgraded energy production systems.
According to the AFPA, average energy used to make a ton of pulp for paper or paperboard in 1994 was 26 million Btu [48]. Historically, the overwhelming majority of mills producing bleached pulp and white papers used chlorine compounds in their bleaching processes. Some alternative processes substitute ozone in combination with other agents; however, ozone is expensive to manufacture. About 15 pounds of ozone is required for every ton of pulp bleached. A new technology developed and patented by Lawrence Berkeley Laboratory saves resources and lowers the cost of ozone production. Called the POZONE process, this method cleans up bleaching and pulping effluents by using yellow phosphorus and air while simultaneously producing ozone as a byproduct [49].
As a rule, paper mills use the high-pressure steam produced by their boilers to power turbine generators, which produce most of the electricity they use. The lower-pressure, lower-temperature steam left over from this operation is then used in mill processes such as cooking and drying. To the extent that more efficient boilers, heat exchangers, and more modern control equipment are used when processes are updated or modified, energy can be saved. The AFPA reports that the average energy used to make a ton of pulp for paper or paperboard declined by 2.3 percent from 1993 to 1994 [50].
The forest products industry is participating with the U.S. Department of Energy (DOE), Office of Industrial Technologies, in the �Industry of the Future� strategy. This involves the development of a vision and technology road map document known as �Agenda 2020,� an agreement between DOE and the AFPA in November 1994. Related DOE activity includes cooperative research and development with biocatalysts and working with a number of companies, coordinated by Oak Ridge National Laboratory, to develop materials for improved efficiency in kraft black liquor recovery boiler operations.
A 5-year research program between 1987 and 1992 conducted by the Biopulping Consortium [51] evaluated several hundred strains of fungus for pretreatment of wood for pulping (�biopulping�). The consortium determined that two particular fungi (Ceriporiopsis subvermispora and Phanerochaete chrysosporium) demonstrated excellent ability to break down lignin in wood. The former of these naturally occurring fungi was effective in breaking down pine and aspen and the latter in breaking down aspen. A followup 4-year program was completed in 1996, and a 5-ton mill scaleup demonstration was successful.
This research [52] showed that electrical energy requirements were reduced by 30 to 40 percent relative to mechanical pulping. A 50-ton commercial trial is pending [53]. Microscopic analysis revealed that the rigid cell walls of wood relax and swell when pretreated in the biopulping process, permitting better yields of wood fiber and reducing pitch content in resulting wood pulp (pitch fouls papermaking machinery). Two weeks of residence time in bioreactors was shown to be sufficient with P. chrysosporium. Aspen subjected to biopulping achieved 80 percent brightness with peroxide bleaching and 60 percent, or newsprint level, with hydrosulfite bleaching�two methods in use commercially that are more environmentally friendly than chlorine bleaching.
The work of the Biopulping Consortium drew from about three decades of previous international research on the natural decay effects of white rot fungi on pine and other topics. When used in conjunction with chemical pulping, it was shown that most paper strength properties increased as a function of the extent of wood decay by these fungi. Laboratory-scale tests using this process and wood feedstocks have shown that yields of fermentable starch for making ethanol can be doubled.
Renewable Energy
Annual 1996
April 1997
[Click on any entry to go there.]