Figure 2-12 Woman washing clothes in the Santa Cruz River, with
the ruins of the Convento in the background.
Photo: Arizona
Historical Society/Tucson 15 |
Not available online. |
| Figure 3-1 Contribution of wellfields to total groundwater
supply. 17 |
 |
| Figure 3-2 Elevation of water table and direction of groundwater
flow. 18 |
 |
| Figure 3-3 Map of wells and wellfields 19 |
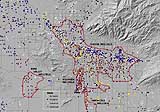 |
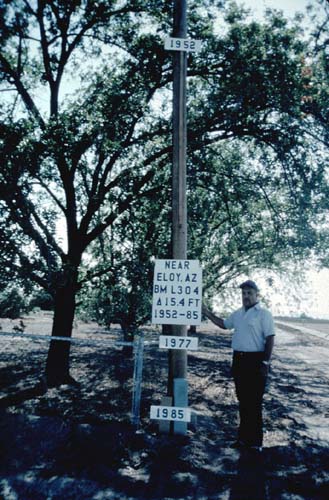
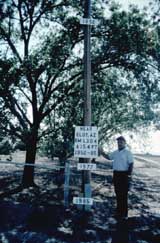
Figure 3-4 Subsidence near Eloy. Dates on the pole mark more
than 15 feet of subsidence from groundwater pumping between 1952 and
1985.
Photo: U.S. Geological Survey. 20 |
 |
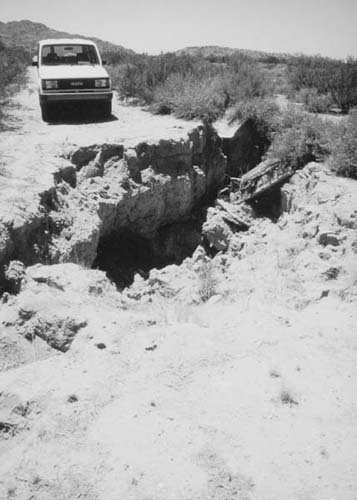
| Figure 3-5 A fissure can appear as a deep gash in the earth. The
above fissure is southeast of Phoenix. Photo: Ray Harris. 21 |
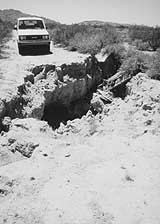 |
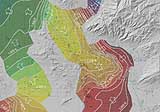
Figure 3-6 Maximum potential subsidence in feet.
Source:
USGS, ADWR 22 |
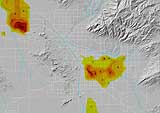 |
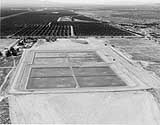
Figure 3-7 Tanks from a Pima County wastewater treatment
plant.
Photo: Barbara Tellman 23 |
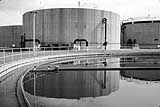 |
Figure 3-8 Wastewater treatment facilities and distribution
system.
Source: Pima County Technical Services, Pima County
Wastewater 24 |
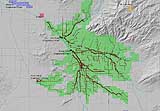 |
Figure 3-9 The Pima Mines Road recharge basin.
Photo: Central
Arizona Water Conservation District 26 |
 |