| Ag 101 | ||
|
||||||||||
|
Economic OverviewU.S. agriculture is a complex system that simultaneously produces unprecedented bounty and unparalleled social concerns. Can the unique institution of the American family farm survive the economic realities of the 21st century? Can the United States continue to have the most abundant and the safest food system in the world? These questions and the unfolding answers will have impacts that will be felt for generations to come. What we know for certain is that:
Agricultural production in the United States is a business that requires very high capital investments in land, facilities, and machines and most often produces undifferentiated products (commodities) of generally low unit value.� Thin profit margins have forced producers to seek efficiencies in all aspects of production.� There are efficiencies of scale that favor large producers who can make the most effective use of large, expensive machines.� In crops such as corn and soybeans, and in poultry and animal production commercially viability is usually based on producing "in volume."
RevenuesGross farm income includes cash receipts from the sale of farm products, government payments arising from farm program participation, the value of fuel, feed, fertilizer, see and other inputs consumed on the farm, and the rental value of farmland and dwellings. Farmers often are able to enhance their income by using futures and/or production contracts to achieve a higher selling price than would be available if a crop was sold at the time it was harvested. Often, production contracts require the seller (the farmer) to achieve certain levels of quality and/or quantity in order to qualify for a premium selling price. Many farms participate in U.S. government farm programs in which income support payments are made to farmers who raise program commodity crops and participate in applicable conservation plans to reduce soil erosion and adhere to wetland protection requirements currently in law. The following table provides an estimate of the per-acre value of major crops grown in the United States in the year 2000. Crop yields vary widely across the country and overall production has an impact on market prices. Table 2. Typical value of major agricultural crops grown in the United States.
Agricultural commodity prices have not kept pace with rising prices in other segments of the economy, which has decimated the number of small farms. Even though the per-acre value of most major crops is low, the volume and value of crop production in the United States is staggering. U.S. farm receipts exceed $200 billion per year. Of that total, approximately 10% comes to the farm in the form of government payments. Almost $50 billion worth of agricultural products are exported each year, helping to offset trade deficits in other sectors of the economy. The agribusiness sector, which provides production agriculture with necessary inputs and which adds value to farm products, continues to thrive. The economic impact of agribusiness is huge. This food and fiber sector accounts for about one-eighth of the U.S. gross domestic product ($1.26 trillion in 2000) and employs just over one-sixth of the U.S. civilian labor force (24.1 million workers). Back to TopProduction ExpensesThe major agricultural commodities produced in the U.S. have relatively low per-acre value. Although crop yields have increased over time due to improved plant genetics and more effective production, fertilization, and pest control programs, crop prices have “failed to keep pace with inflation.” For example, the average price paid to farmers for soybeans in 2000 was $4.40 per bushel, the lowest average price since 1972, and a 40 percent decline since 1996. USDA tracks both prices received for farm products and prices paid for production inputs. Using the 1910-1914 period as a base, the prices received by today’s farmer have increased by a factor of six. However, prices paid by farmers for production inputs have increased by a factor of sixteen! Thin profit margins have forced producers to seek efficiencies in all aspects of production. Efficiencies of scale favor large producers who can make the most effective use of large, expensive machines. In crops such as corn and soybeans, commercially viability is based on producing "in volume." These forces have dramatically changed the size and numbers of farms. Back to TopExpense CategoriesLand:� The average price of an acre of U.S. farmland is over $1,000. Prime farmland in the Corn Belt can sell for over $3,000 per acre (2000). In the Midwest, cash rental prices for land range from $10 per acre per year for pasture to over $100 for highly productive cropland. Machinery:� The variety of machines for producing crops is as great as the variety of crops produced. However, there are certain “staple” technologies such as tractors and combines that serve to illustrate the magnitude of investment that modern farmers must make in machinery.
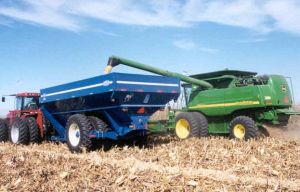
It is often puzzling to non-farmers to see expensive equipment stored in sheds and/or sitting idle for months at a time. Why would a farmer invest $300,000 in a large combine only to use it for four weeks out of the year? How could a farmer possibly justify spending upwards of $200,000 for a tractor that is used for little else but tillage? The simple, but important, answer is TIMELINESS. Crops are biological “products” that produce optimum yields only when planting and harvest operations can be performed within relatively small windows of time. For instance, the optimum harvest window for corn in Eastern Illinois is only 30 days long and for wheat in Kansas the harvest window is only 10 to 14 days. This requires the use of large equipment that is used very intensively for relatively short periods of time. Production InputsThe per-unit costs of agricultural production inputs such as feed, fertilizers, crop chemicals, and seed also vary widely due to production systems. For instance, a corn farmer might have nitrogen fertilizer costs of $50 per acre while a soybean farmer down the road might have no nitrogen fertilizer costs due to a "legume" ability to fix nitrogen. Crop chemicals such as herbicides, insecticides, and fungicides are applied on an "as-needed" basis and applications vary widely from farm-to-farm, and from crop-to-crop. Seed costs tend to vary somewhat less. For instance, farmers in Indiana paid an average of over $90 per bag of seed corn and about $21 per bushel of soybeans in 2001. The bag of seed corn would plant about 2 ½ acres, while the bushel of soybeans would plant about an acre. In addition to land, machinery, fertilizer, crop chemicals, and seed, farmers face costs for buildings, grain handling facilities, hired labor, fuel for vehicles, heating, and conditioning crops, livestock, feed and veterinary care for the livestock, taxes, crop insurance, property insurance, and the list goes on. All of the expenses add to the challenge of remaining profitable and economically viable for the long term. Back to TopSocial and Economic Interactions and the Structure of U.S. Agriculture
State governments have traditionally promulgated and enforced environmental policies with respect to farm level production. However, varying political forces across state lines have led to different degrees of regulation and enforcement. There is anecdotal evidence suggesting that such differences are responsible for shifts in livestock production to non-traditional areas (and less regulated) with less stringent regulation and often where there is little or no crop base to utilize the manure nutrients. Such shifts in economic activity may have social and environmental consequences that are not always in society's best interest. Economics Study QuestionsIdentify the definition that best fits the following terms: Back to Top
|
|
|
||
|
|
 "Consolidation"
and "concentration" are perhaps the most apt words to characterize
the structural change in American agricultural production over the past
two decades. The number of farms with hogs in the United States declined
from almost 700,000 in 1980 to approximately 70,000 in 2000. At the same
time, the percentage of hogs produced by the largest sized farms (greater
than 5,000 head inventory) rose from 20 percent of total U.S. production
in 1992 to approximately 50 percent in 2000. Similar statistics also exist
for poultry and crop production in the U.S.
"Consolidation"
and "concentration" are perhaps the most apt words to characterize
the structural change in American agricultural production over the past
two decades. The number of farms with hogs in the United States declined
from almost 700,000 in 1980 to approximately 70,000 in 2000. At the same
time, the percentage of hogs produced by the largest sized farms (greater
than 5,000 head inventory) rose from 20 percent of total U.S. production
in 1992 to approximately 50 percent in 2000. Similar statistics also exist
for poultry and crop production in the U.S. This
shift toward larger production units and the substitution of chemical
and mechanical inputs for labor have raised a variety of social and economic
issues. For example, there are questions concerning the environmental
sustainability of modern agricultural production systems. More recently,
low product prices, larger government payments to farmers, and increased
use of alternative business arrangements such as contracting have also
brought into question the economic and social sustainability of the current
agricultural industry structure.
This
shift toward larger production units and the substitution of chemical
and mechanical inputs for labor have raised a variety of social and economic
issues. For example, there are questions concerning the environmental
sustainability of modern agricultural production systems. More recently,
low product prices, larger government payments to farmers, and increased
use of alternative business arrangements such as contracting have also
brought into question the economic and social sustainability of the current
agricultural industry structure.