Office of Air and Radiation
EPA 402-R-93-003, June 1993PROTOCOLS FOR RADON AND RADON DECAY
PRODUCT MEASUREMENTS IN HOMESAPPENDIX A
STATE AND EPA REGIONAL RADON OFFICES
APPENDIX B
INTERPRETATION OF THE RESULTS OF SIDE-BY-SIDE MEASUREMENTS
B.1. Assessment of Precision B.2. Example Control Charts for Precision B.3. Interpretation of Precision Control Charts Because radon and working level measurements, like all measurements, usually do not produce exactly the same results, even for simulataneous (duplicate) colocated measurements. The objective of performing simultaneous or duplicate measurements is to assess the precision error of the measurement method, or how well two side-by-side measurements agree. This precision error is the "random" component of error (as opposed to the calibration error, which is systematic). The precision error, or the degree of disagreement between duplicates, can be composed of many factors. These include the error caused by the random nature of counting radioactive decay, slight differences between detector construction (for example, small differences in the amount of carbon in activated carbon detectors), and differences in handling of detectors (for example, differences in accuracy of the weighing process, and variations of analysis among detectors).
It is critical to understand, document, and monitor your precision error. This knowledge and documentation will allow you to characterize your precision error to clients. Furthermore, the continual monitoring of precision provides a check on every aspect of the measurement system.
There is a variety of ways to quantitatively assess the precision error based on duplicate measurements. It is first necessary to understand that precision is characterized by a distribution; that is, your side-by-side measurements will exhibit a range of differences. There is some chance that any level of disagreement will be encountered, due merely to the statistical fluctuations of counting radioactive decays. The probability of encountering a very large difference between duplicates is smaller than the chance of observing a small difference similar to those that are routinely observed. It is important to recognize that a few high precision errors do not necessarily mean that the measurement system is flawed.
Ideally, the results of duplicates should be assessed in a way that allows for the determination of what level of chance is associated with a particular difference between duplicates. This will allow for the pre-determination of limits for the allowable differences between duplicates before an investigation into the cause of the large differences is made. For example, the warning level, or the level of discrepancy between duplicates which triggers an investigation, may be set at a five percent probability. This level is a difference between duplicates that is so large that, when compared with previous precision errors, should only be observed five percent of the time. A control limit, where further measurements should cease until the problem is corrected, may be set at one percent probability.
A control chart for duplicates is not as simple as a control chart used to monitor instrument performance, as for a check source. This is because the instrument's response to a check source should be fairly constant with time. Duplicates are performed at various radon concentrations, however, and the total difference between two measurements is expected to increase as radon levels increase.
Use of statistics such as the relative percent difference (RPD; difference divided by the mean) or the coefficient of variation (COV; standard deviation divided by the mean) can be used in a control chart for duplicate measurements at radon concentrations where the expected precision error is fairly constant in proportion to the mean, e.g., at levels greater than around 4 pCi/L or 0.02 WL. At lower concentrations, for example, between 2 pCi/L (or 0.01 WL) and 4 pCi/L (or 0.02 WL), a control chart may be developed by plotting these same statistics; however, the proportion of the precision error to the mean will be greater than that proportion at levels above 4 pCi/L or 0.02 WL. At concentrations less than about 2 pCi/L, or 0.01 WL, the lower limit of detection may be approached, and the precision error may be so large as to render a control chart not useful.
Example control charts, using three different statistics, are described in the following sections.
B.2 Example Control Charts for Precision
Before a control chart can be developed, it is necessary to know, from a history of making good quality measurements with the exact measurement system (detectors, analysis equipment, and procedures), the level of precision that is routinely encountered when the system is operating well or "in control." It is that "in control" precision error that forms the basis of the control chart, and upon which all the subsequent duplicate measurements will be judged. There are two ways of initially determining this "in control" level. The first, and preferable, way is to perform at least 20 duplicate pairs of measurements at each range of radon concentrations for which a control chart is to be prepared. For example, if you will only assess precision at concentrations greater than 4 pCi/L, or 0.02 WL, you will need at least 20 pairs of measurements at concentrations greater than 4 pCi/L, or 0.02 WL, to assess the "in control" level. The average precision error (RPD or COV) should be the "in control" level.
The second way to initially set the "in control" precision error level is to use a level that has been used by others, and that is recognized by industry and EPA as a goal for precision, for example, a 10 percent COV (corresponding to a 14 percent RPD). After at least 20 pairs of measurements are plotted, it will become apparent whether the 10 percent COV (or 14 percent RPD) is appropriate for your system. If itis not, a new control chart (using the guidelines below) should be prepared so that the warning and control limits are set at the correct probability limits for your system.
B.2.1 Sequential Control Chart Based on Coefficient of Variation
It can be shown (Iglewicz and Myers 1970, EPA 600/9-76-005; U.S. EPA 1984) that when the expected precision is a constant function of the mean, control limits can be expressed in terms of the COV (COV=S/Xm; where S is the variance or the square of the standard deviation, and Xm is the mean or average of the two measurements). One method for obtaining percentiles for the distribution of the COV is to apply a chi-squared (X2) test:
X2n-1 = B[(n-1)COVn2/(n+(n-1)COVn2)] (Equation 1)
where: B = n[1 + (1/COV2)];
COVn = the observed COV of the nth pair (the pair that is to be evaluated); and
COV = the "in control" COV (e.g., 10 percent at levels greater than 4 pCi/L).
For duplicates, where n=2, Equation 1 becomes
X2 = [2 + (2/COV2)][COVn2/(2 + COVn2)] (Equation 2)
For a value of 0.10 for COV, it further reduces to
X2 = 202[COVn2/(2 + COVn2)] (Equation 3)
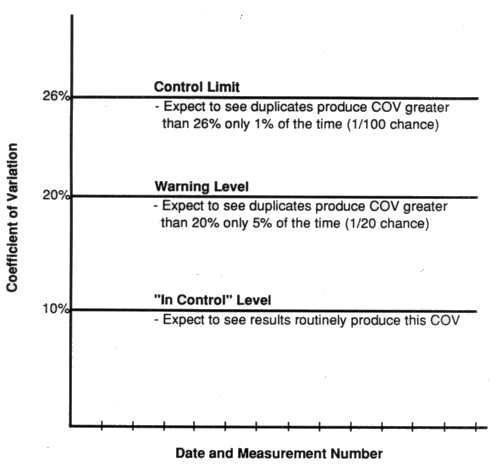
Referring to a X2 chart, you learn that the probability of exceeding a X2 of 3.84 is only five percent. Inserting this value of 3.84 for X2 and solving for COVn, produces a COVn of 0.20. This level of probability forms the warning level shown in Exhibit B-1. The control limit corresponds to a X2 of 6.63 and a COVn of 0.26, where the probability of exceeding those values is only one percent.
This sequential control chart should be used by plotting results from each pair on the y-axis, and noting the date and measurement numbers on the x-axis.
B.2.2 Sequential Control Chart Based on Relative Percent Difference
The RPD (or percent difference) is another expression of precision error, and is given by
RPD = [100Ix1-x2I]/[(x1+x2)/2] (Equation 4)
For n=2,
RPD = COV SQRT 2 (Equation 5)
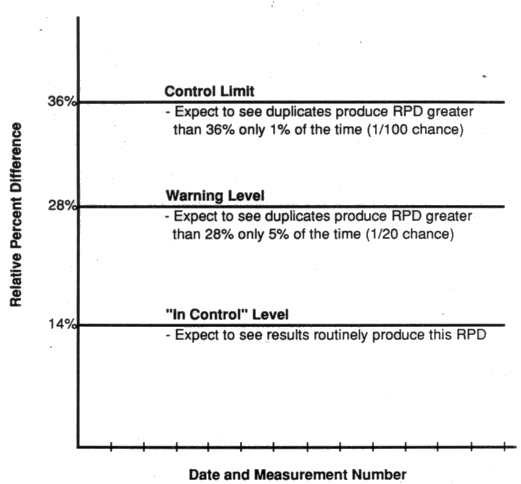
The control limits for RPD can be obtained simply by multiplying the control limits for COV by the square root of two, or 1.41. These limits are shown in Exhibit B-2. This sequential control chart for RPD should be used in the same way as the control chart for COV, that is, with the vertical scale in units of RPD and the horizontal scale in units of date and measurement numbers.
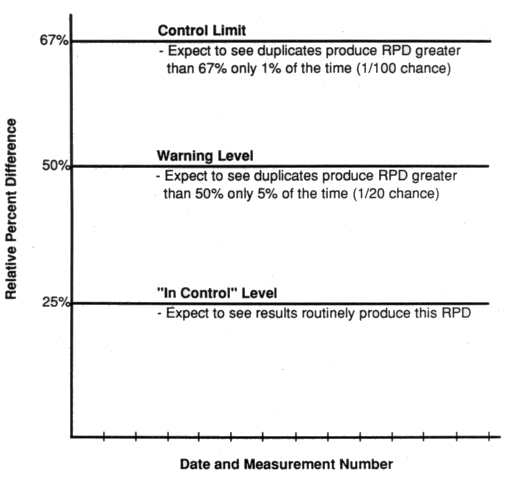
A control chart using the statistic RPD based on an "in control" level of 25 percent RPD is shown in Exhibit B-3. The warning level and control limit are set at 50 percent and 67 percent, respectively. Use of these limits may be appropriate for measured radon concentrations less than 4 pCi/L.
Exhibit B-1
Control Chart* for Coefficient of Variation (COV)
Based on an "In Control" Level of 10%
(For duplicates where average >4 pCi/L or 0.02 WL)
COV=standard deviation of two measurements divided by their average
Example: Detector A=5 pCi/L, B=6 pCi/L, COV=13%
If COV exceeds the control limit--cease measurements until the problem is identified and corrected.
If COV exceeds the warning level--follow guidance in Section B.3 and see Exhibit B-5.
*As calculated from guidance provided in "Quality Assurance Handbook for Air Pollution Measurement Systems: Volume I" (EPA 600/9-76-005; U.S. EPA 1984)
Exhibit B-2
Control Chart* for Relative Percent Difference (RPD)
Based on an "In Control" Level of 14% (=COV of 10%)
(For duplicates where average >4 pCi/L or 0.02 WL)
RPD=difference between two measurements divided by their average
Example: Detector A=5 pCi/L, B=6 pCi/L, RPD=18%
If RPD exceeds the control limit--cease measurements until the problem is identified and corrected.
If RPD exceeds the warning level--follow guidance in Section B.3 and see Exhibit B-5.
*As calculated from guidance provided in "Quality Assurance Handbook for Air Pollution Measurement Systems: Volume I" (EPA 600/9-76-005; U.S. EPA 1984)
Exhibit B-3
Control Chart* for Relative Percent Difference (RPD)
Based on an "In Control" Level of 25% (=COV of 18%)
(For duplicates where average <4 pCi/L or 0.02 WL)
RPD=difference between two measurements divided by their average
Example: Detector A=2 pCi/L, B=3 pCi/L, RPD=40%
If RPD exceeds the control limit--cease measurements until the problem is identified and corrected.
If RPD exceeds the warning level--follow guidance in Section B.3 and see Exhibit B-5.
*As calculated from guidance provided in "Quality Assurance Handbook for Air Pollution Measurement Systems: Volume I" (EPA 600/9-76-005; U.S. EPA 1984)
B.2.3. Range Control Chart
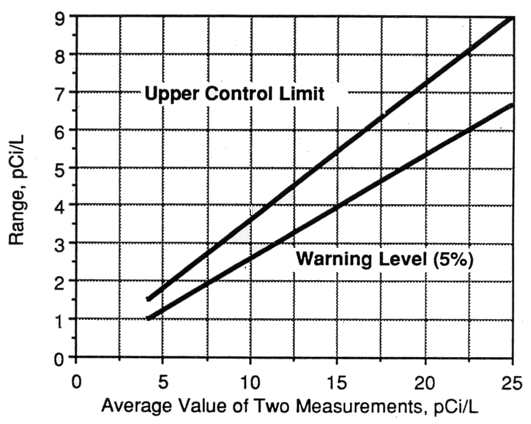
A range control chart (Goldin 1984) can be constructed to evaluate precision, using the statistics of the range (difference between two measurements) plotted against the average of the two measurements. The control limits are again based on the variability of the measurements, as decided upon from previous results or using an industry standard (e.g., 10 percent).
In this type of control chart, the limits are expressed in terms of the mean range (Rm), where, for n=2,
Rm = 1.128 s(x) (Equation 6)
where s(x) is the standard deviation of a single measurement, which reflects counting and other precision errors. Goldin shows that the limits can be expressed as follows:
Control limit = 3.69 s(x) (Equation 7)
Warning level = 2.53 s(x) (Equation 8)
An example range control chart, using an assumed s(x) equal to 10 percent of the mean concentration, is shown in Exhibit B-4. The chart is used by plotting the range versus average concentration as duplicate measurements are analyzed.
Exhibit B-4
Range Control Chart to Evaluate Precision
(Limits Based on s(x)=0.1xm)
If results exceed the control limit--cease measurements until the problem is identified and corrected.
If results exceed the warning level--follow guidance in Section B.3 and see Exhibit B-5.
B.3 Interpretation of Precision Control Charts
The control chart should be examined carefully every time a new duplicate result is plotted. If a duplicate result falls outside the control limit, repeat the analyses if possible. If the repeated analyses also fall outside the control limit, stop making measurements and identify and correct the problem.
If any measurements fall outside the warning level, use the table in Exhibit B-5. Refer to the row showing the number of duplicate results outside the warning level. If the total number of duplicate results accumulated in the control chart is contained in column A, investigate the cause of the high level of precision error but continue making measurements. If the total number of duplicate results on the chart is contained in column B, stop making measurements until the cause for the high precision error is found, and it is determined that subsequent measurements will not suffer the same high level of precision error.
Note that the example control charts shown here are simplifications of actual conditions, because they are premised on the assumption that the precision error is a constant fraction of the mean concentration. In fact, the total precision error may best be represented by a different function of the mean concentration, for example, the square root of the concentration. The most accurate control chart can be rendered by a range control chart using the measurement uncertainty expressed as the standard deviation, s(x), expected at the concentrations where measurements are made. If the precision error is not a constant fraction of the mean, the control limits will not appear as straight lines, but may exhibit changing slope. However, methods discussed here present a conservative way to monitor, record, and evaluate precision error and are very useful for comparing observed precision errors with an industry standard.
Exhibit B-5
Criteria for Taking Action for Measurements Outside the Warning Level*
Number of
Duplicate Results
Outside the
Warning LevelTotal Number of Duplicates Investigate, But
Continue Operations
AStop Operations
Until Problem is Corrected
B2 8-19 2-7 3 17-34 8-16 4 29-51 17-28 5 41-67 29-40 6 54-84 41-53 7 67-100 54-66 *Modified from Goldin (Goldin 1984) and based upon cumulative
probability tables of the binomial distribution.Table of Contents || Section One || Section Two || Section Three || Section Four || Glossary || References
http://www.epa.gov/iaq/radon/pubs/homprot6.html
Created: July 30, 1999