| ch. 5, pp. 43 - 44 |
Water is used for many purposes, including growing crops, producing copper, generating electricity, watering lawns, keeping clean, drinking and recreation. Balancing the water budget comes down to increasing the supply and/or decreasing the demand. In Chapter 3 we discussed the supply side of the water budget. Reducing demand involves reducing how much water each person uses, limiting the number of people using water (or slowing the rate of growth), and/or replacing some uses with other uses. To understand what these choices are, we must first understand how water has been used in the past and how it is used today.
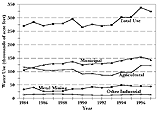
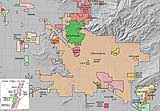
There are three major groups of water users: homes and businesses, agricultural interests, and industry (including mining). The increase in municipal water use during the 1980s was offset by decreasing agricultural use, with total water use in the Tucson area holding steady during this period at about 275,000 acre-feet. (See Figure 5-1.) Agricultural use has risen since 1993. That, coupled with rising municipal use, pushed total water use to 323,000 acre-feet by 1997. Agriculture has historically consumed the largest share of water of any sector in the Tucson area. After reaching a plateau between 1955 and 1975, however, agricultural water use declined during the 1980s and early 1990s. Municipal water use has increased since 1984 as the population has grown — both in total acre-feet used and in percentage of total water use, and now consumes a larger share than does agriculture. Population growth has caused municipal water use to be the fastest growing water use sector. Total municipal water use in the Tucson Active Management Area (TAMA) increased from approximately 116,000 acre-feet in 1985 to about 154,000 acre-feet in 1997. One hundred and fifty-one municipal water providers operate in the Tucson area. Of this number, 19 large providers serve over 96 percent of total municipal demand. The service areas of the major water providers are shown in Figure 5-2. See Appendix B for a complete list of municipal water providers and number of customers served. Tucson Water is by far the largest municipal provider in TAMA, serving approximately 75 percent of total municipal demand. Approximately 40 percent of the population served by Tucson Water resides outside of the city limits, mostly in unincorporated areas of Pima County. Tucson Water’s service area is projected to continue to grow, but the rate of growth has been slow. Metropolitan Domestic Water Improvement District (Metro Water) serves the next largest population. Other water providers closer to the edges of the Tucson metropolitan area, such as Oro Valley, Avra Water, and Metro Water, tend to be the fastest growing. Rapidly growing service areas generally are areas of rapid population growth and newer homes. These homes are likely to have water-saving fixtures and smaller yards, but are also more likely to have certain water consumptive facilities such as swimming pools.
Tucson Water's total water usage rate in 1955 was 172 gallons per capita per day (gpcd) including both residential and non-residential customers. It has remained fairly constant since 1985, ranging between 176 and 169 gpcd. Some changes in use relate to different weather conditions. For example, people tend to use more water during hot, dry summers than during relatively cooler, wetter ones. More homes having swimming pools and other water-using features increases water usage while installing low-water use toilets can decrease consumption. Residential customers (single family and multi-family) are considered municipal water users along with businesses and institutions. Water use characteristics generally differ for each category of demand, with residents consuming most of the water in the municipal category. Residential demand for Tucson Water has remained fairly consistent at about 110 gpcd from 1985 to 1995. The average residential consumption rate for other large providers is higher, averaging about 121 gpcd. A number of factors explain the higher consumption rates of these large providers, including the age of the housing within the service area, the availability and effectiveness of conservation programs, income levels and water rates.
|


