Source: IPC Technology Marketing Research Council, June 1994.
Table 1-3. Quantity and Value of Domestic PWB
Production.
Another historical shift over the past ten years has been outsourcing PWB manufacturing. In
1980, captive OEM operations accounted for about 50% of the PWB market. Independent
or merchant PWB manufacturers accounted for the other half. As is clear from Figure 1-6, captive houses have been shutting down their PWB manufacturing operations
and instead purchasing PWBs from the smaller independent manufacturers.

Now, only one quarter or less of the PWB manufacturing is done by captive houses. The
remaining 75% to 80% is produced by independent PWB manufacturers. The reason for this
shift is that OEMs are focusing on their core business assembling the final consumer products rather than
manufacturing all the intermediate components such as PWBs or cathode ray tubes (CRTs).
Thus, the OEMs now frequently purchase components (including PWBs, CRTs,
subassemblies, drives, etc.) that can be readily out-sourced. Boards are
purchased from independent PWB manufacturers who specialize only in PWB production, rather than
try to maintain the hefty costs, expensive equipment, personnel, and technical expertise
required for in-house PWB production. The introduction of computer-aided design (CAD)
has also facilitated the transfer of design information, and therefore, the outside manufacture of
PWBs.
C. Imports/Exports
Import and export data on the PWB market is extremely difficult to estimate, primarily because the
nomenclature and codes used by the International Trade Commission and the U.S. Department of
Commerce are confused by printed wiring assembly and printed wiring board importers and exporters.
Printed wiring assemblies are printed wiring boards on which electronic components such as integrated
circuits, capacitors, and resistors have been mounted. With such valuable components
mounted on them, the value of PWAs are clearly much greater than bare PWBs.
By combining the U.S. Department of Commerce data with their market research, the
IPC estimates that domestic PWB imports are approximately $500 to $600 million annually.
The largest single importer is Taiwan with about 30% to 35% of the import market.
Japan, Hong Kong, Korea, and Thailand each have about 10% of the import
market. With respect to exports, it is estimated that total domestic PWB exports amounted to
about $100 million dollars in 1993 (2% to 3% of total domestic production).
This estimate does not include PWBs exported by OEMs in their equipment.
D. Major Domestic Markets and Trends
The seven basic markets for printed wiring boards are described below.
- Automotive: engine and drive performance, convenience and safety, entertainment
(radios), and other applications for diagnostic display and security.
- Communication: mobile radio, touch tone, portable communication,
pagers, data transmissions, microwave relay, telecommunications and telephone switching
equipment, and navigation instruments.
- Consumer electronics: watches, clocks, portable calculators, musical
instruments, electronic games, large appliances, microwave ovens,
pinball/arcade games, television, home entertainment, video records, and smoke
and intrusion detection systems.
- Computer/business equipment: mainframe computers, mini computers, broad
level processors, add-on memory, input/output devices, terminals,
printers, copy machines, facsimile machines, word processors, cash registers,
teaching machines, gas pumps, and taxi meters.
- Government/military/aerospace: radar, guidance and control systems,
communication and navigation, electronic warfare, ground support, sonar ordinance,
missiles, and satellite and related systems.
- Industrial electronics: machine and process control, production test and measurement,
material handling, machining equipment, pollution, energy and safety equipment,
numerical controls, power controls, sensors, and weighing equipment.
- Instrumentation: test and measurement equipment, medical instruments and medical
testers, analytical, nuclear, lasers, scientific instruments, and implant
devices.
A summary of the market share for these various groups is shown in Figure 1-7. By far the largest market is computers and business equipment, followed
by communications and automotive. Automobiles will use increasing amounts of electronics, and
communications demand will continue strong growth. Computer and business equipment may be
leveling off, while government and military electronic demand is expected to remain weak in the face of
Congressional budget cuts. Since the majority of consumer electronics products
(e.g., TV, stereo, VCR) sold in the United States are produced off-shore with off-shore PWBs, changes in the domestic consumer market will probably have little effect
on domestic PWB production. These trends are expected to continue for at least the near
future.

E. Analysis of Laminates and Process Consumables for Rigid
Boards
The printed wiring board product market is normally broken down in one of two ways: either by
the type of substrate used (glass, paper, composite) or the type of board produced
(single-sided, double-sided, multilayer). Table
1-4 shows the U.S. market summary for PWB production broken down by type of substrate
used for rigid PWBs. Glass substrates compose the largest market segment by far. In addition to
rigid PWBs, the United States also produces approximately $400 million of flexible
circuitry.
| Type of Substrate |
PWB Dollar Volume |
Laminate (ft2) |
| Glass, 1-sided |
$110.2 |
6.03 |
| Glass, 2-sided |
$1,115.0 |
64.08 |
| Glass, thin |
$2,892.3 |
118.0 |
| High-performance |
$458.0 |
7.0 |
| Paper, 1-sided |
$8.0 |
1.0 |
| Paper, 2-sided |
$0.0 |
0.0 |
| Composite, 1-sided |
$425.2 |
38.0 |
| Composite, 2-sided |
$48.8 |
2.0 |
| Totals for Rigid PWBs |
$5,057.6 |
236.0 |
Source: IPC Technology Marketing Research Council, June 1994.
Table 1-4. Domestic Rigid PWB and Laminate Production by Type of
Substrate Used (all dollars in millions/all square feet in millions).
As part of the 236 million square feet of laminate used in 1993, the PWB industry consumed
approximately 587 million square feet of copper foil and 52 million pounds of epoxy resin. The
industry also consumed approximately 60 million pounds of fiberglass yarns used in 322 million square feet
of pre-preg. Pre-preg is un-cured epoxy-fiberglass material used to separate and electrically insulate
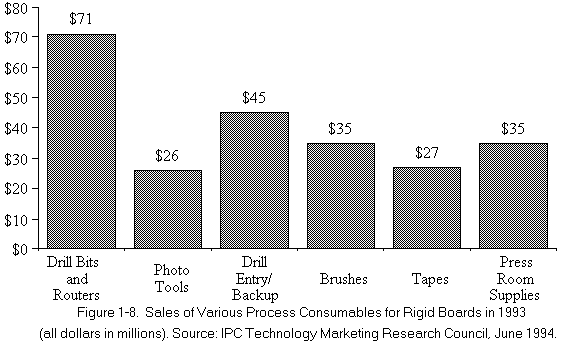
the layers of circuitry in a multilayer PWB. Figure 1-8 summarizes
the sales of various process consumables in 1993, such as drill bits, brushes, and
tapes. These process consumables exclude laminates as well as other chemicals. The value of
chemicals used in the industry was approximately $520 million. The primary chemicals used
include the following:

- Plating chemistries (additive, electroless, electrolytic,
etchback/desmear, oxide);
- Solder mask (dry film, photoimagible liquid, screen-defined);
- Etchants (ammoniacal, peroxide sulfuric, solder neutralizer);
- Imaging products (dry film, photoimagible liquid, screen defined,
resist);
- Imaging chemicals (aqueous and insolvent developers and strippers); and
- Other chemicals (fluxes, metal strippers, cleaners, anti-tarnish, waste
treatment chemistries).


