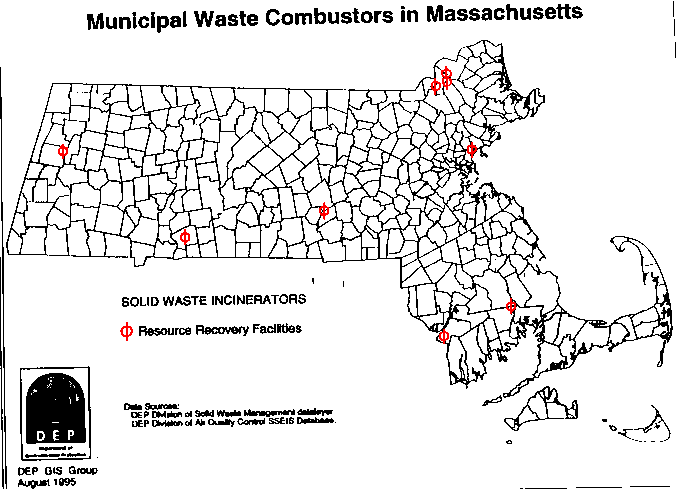
Municipal Solid Waste Combustors (MSWCs) are facilities that combust (burn) solid waste, in large part derived from domestic (household) wastes. There are nine municipal solid waste combustors currently in operation in Massachusetts and these facilities combust approximately 3.3 million tons of trash each year. The locations of these facilities are depicted in Figure 3-4.
USEPA has identified MSWCs as being a major source category of mercury emissions to the environment (USEPA, 1993). An emission limit of 80 ug of mercury per dry standard cubic meter corrected to 7% oxygen or a minimum 85% reduction in mercury emissions in the flue gases has been adopted for such facilities (Federal Register, Vol. 60(243), December 19, 1995). This limit is technology-based and represents the Maximum Achievable Control Technology (MACT) as required by the 1990 Amendments to the (Federal) Clean Air Act (for a more detailed discussion of the basis of this EPA proposal please see Chapter 5, Emission Control Requirements section). Based on past emissions monitoring many MA MSWCs will need to reduce the concentrations of mercury in their stack emissions to meet this new standard.
As discussed in the preceding section, mercury in municipal solid waste is derived from the disposal of a variety of products, including certain batteries, thermometers, thermostats, and fluorescent and other high intensity lights. An indirect estimate of potential mercury emissions from MSWCs can be derived based on the mass of mercury estimated to enter MSW from the sources considered- a total of 4,677 - 8,292 pounds/year. As discussed earlier, Massachusetts incinerated approximately 50% and recycled about 30% of its total municipal solid waste in 1994. Because recycling efforts remove more non- or low mercury containing products from the waste stream, approximately 68% of the mercury containing wastes (i.e. from 3,180 - 5,639 pounds of mercury) is estimated to have entered MSWCs in 1995.
Depending on the effectiveness of the installed air pollution control devices present at these plants it is likely that 50-90% of this mercury would exit these facilities as air emissions, yielding an emission estimate ranging from 1,590 - 5,075 pounds of mercury per year. This is an indirect estimate that is not based on actual stack test data. The derivation of more direct emission estimates, based on stack tests, is discussed below.
Under Massachusetts General Law Chapter 111, Section 21-H, 5(c)
MSWC facilities are required to test stack emissions for mercury
and other heavy metals every 9 months. The stack test method
used, USEPA Method 101A, is discussed in more detail in Appendix C.
Stack test data of operational facilities provides more direct
estimates of MSWC mercury emissions than those noted above and
thus have been used to estimate yearly mercury emissions from
each MSWC in MA.

MAP Monitoring results and yearly emission estimates are presented below for each MA facility. Average emission rates for tests conducted over the past three years were used to estimate total mercury emissions from this source category in MA. This three year estimate was used instead of only the most recent test results to improve the statistical stability of the estimate; a single stack test result would be unstable as it would not account for any of the anticipated variability in emissions due to differences in waste composition as well as other factors. Because mercury disposal in MSW is likely to have decreased somewhat over the past several years due to U.S. manufacturers phase-out of mercury-added alkaline batteries these estimates may over-predict current emissions somewhat.
In addition to air emissions, mercury may also exit these facilities in ash, in particular fly ash captured by various APCDs, and APCD scrubber water. Depending on the APCDs in use, fly ash may contain significant amounts of mercury. The proper disposal of this material largely isolates any mercury contained in the ash from the general environment. Thus, detailed estimates of mercury in ash have not been calculated. It is important to note, however, that potential mercury contamination of ash limits beneficial use options for this material. With respect to scrubber water, quantitative mercury release estimates have not been determined since few MA MSWCs use these APCDs. Massachusetts Facilities: Monitoring and Emissions Information
Differences in stack test results for mercury or other pollutants may reflect a complex set of parameters including variability in the types of pollution control devices installed, in the composition of the wastes burned (which may vary from day to day), and in other specific operational parameters, including, for example, flue gas temperatures. To account for some of the differences in the operational parameters between facilities, results are typically normalized to standard conditions. As noted in the text box below, stack concentrations are typically reported in units of mass of pollutant per dry standard cubic meter of flue gas. This adjustment to standard conditions is important in that it allows comparisons to be made between samples from different stacks or from the same stack at different times.
Stack test results are also corrected on the basis of flue gas concentrations of either oxygen or carbon dioxide. When normalized using a 7% oxygen correction, the reported in-stack concentration of mercury will be approximately 5% higher, for most operating conditions, compared to the use of a 12% carbon dioxide correction for the same sample. However, and most importantly with respect to total mercury emissions (rather than stack concentrations), the amount of mercury emitted per unit time (e.g. pounds per hour) remains the same no matter which correction is applied.
As a 5% difference in mercury concentrations is relatively insignificant and since the mass emission rates are the same, the data summarized in the tables and histograms shown below is presented as reported to the Department. Specifically, the data for the Millbury, North Andover, Saugus, Lawrence and Haverhill facilities was reported using the 7% oxygen correction factor; the Springfield and Pittsfield MSWC data using 12% carbon dioxide; and the SEMASS Partnership facility (SEMASS) data using 12% carbon dioxide for tests prior to 1993 and 7% oxygen for those after this date.
|
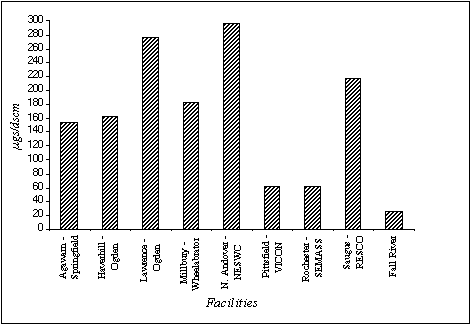
Table 3-7 identifies each MSWC currently in operation in Massachusetts, the types of pollution control equipment in use at each facility and mercury stack test data for the most recent round of sampling. Figure 3-5 presents this data graphically. As can be seen in Table 3-7, for this set of tests, in-stack concentrations of mercury ranged from a low of approximately 26 to a high of 297 µg mercury/dscm for Fall River and N. Andover-NESWC, respectively. The average equals approximately 160 µg mercury/dscm or approximately twice the new USEPA limit of 80 µg mercury/dscm.
Based on this data, six of the nine facilities will need to reduce mercury emissions to meet this new limit. This will necessitate a reduction in the mercury content of the wastes being combusted and/or the installation of additional air pollution control technologies such as carbon injection.
| FACILITY NAME | MONTH/ TEST YEAR | AIR POLLUTION CONTROL EQUIPMENT | MERCURY IN-STACK (µg)/(dscm) |
|---|---|---|---|
| Agawam-Springfield | 10/94 | SDA/FF | 153.1 |
| Haverhill-Ogden | 9/94 | SDA/ESP | 163.0 |
| Lawrence-Ogden | 9/94 | ESP/DLI | 276.0 |
| Millbury-Wheelabrator | 3/94 | SDA/ESP | 183.0 |
| N. Andover-NESWC | 7/94 | DSIS/ESP | 297.0 |
| Pittsfield-VICON | 8/94 | PBS/ESP/FGR/C | 61.4 |
| Rochester-SEMASS | 10/94 | SDA/FF | 61.0 |
| Saugus-RESCO | 7/94 | SDA/FF | 17.0 |
| Fall River | 5/94 | PS/IWS | 25.6 |
| ***N.B.: | |||
|
SDA - Spray Dry Absorber DSIS - Dry Sorbent Injection System FF - Fabric Filter DLI - Dry Lime Injection C - Cyclone FGR - Flue Gas Recirculation |
PS - Plate Scrubber IWS - Ionizing Wet Scrubber PBS - Packed Bed Scrubber ESP - Electrostatic Precipitator dscm - Dry Standard Cubic Meter | ||
Mercury Stack Test Results Massachusetts Resource Recovery Facilities
Springfield - Agawam Mercury Test Summary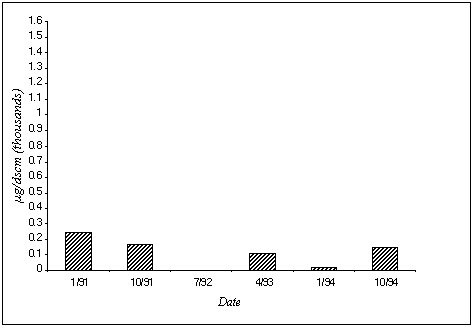
Haverhill - Ogden Mercury Test Summary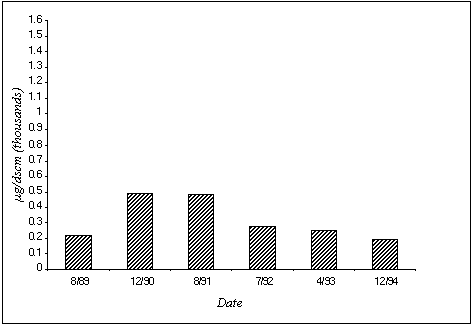
Lawrence - Ogden Mercury Test Summary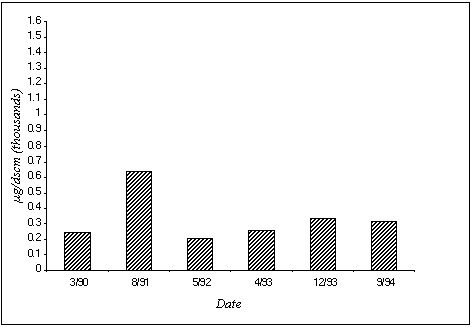
Millbury - Wheelabrator Mercury Test Summary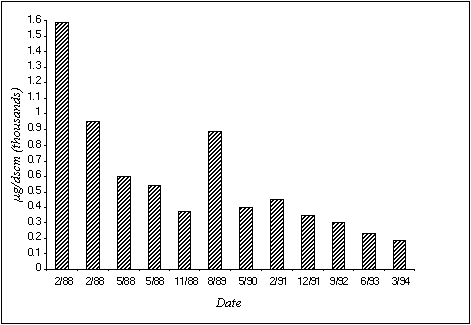
North Andover - NESWC Mercury Test Summary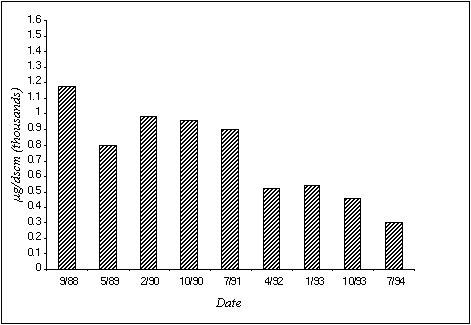
Pittsfield - VICON Mercury Test Summary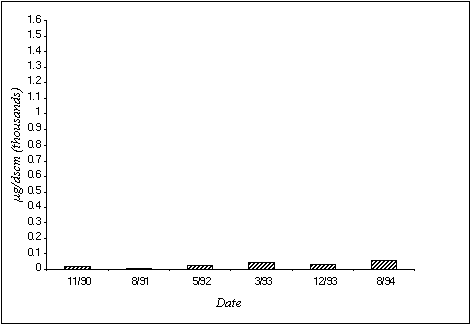
Rochester - SEMASS Mercury Test Summary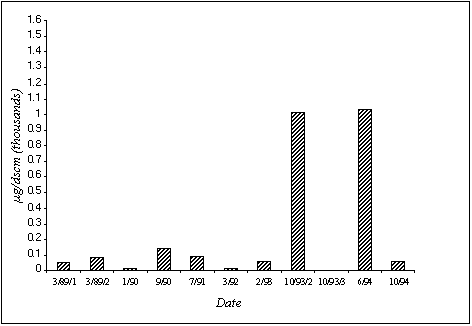
Saugus - RESCO Mercury Test Summary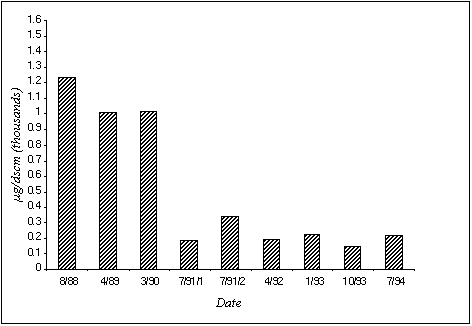
These data indicate that the Haverhill, Lawrence, Millbury, North Andover, and Saugus facilities consistently exhibited stack concentrations of mercury above the USEPA proposed standard of 80 µg/dscm (Figures 3-7 to 3-10, and 3-13 respectively; note that in these Figures 0.1 µg/dscm X 1000 equals 100 µg/dscm ).
Mercury flue gas concentrations at the Pittsfield facility tested below the USEPA proposed standard in all tests since 1990 (Figure 3-11). This facility consistently had the lowest mercury concentrations suggesting that its APC configuration (it is equipped with Packed Bed Scrubber/Electrostatic Polisher/Flue Gas Polisher/Cyclone) may be an effective control approach. Alternatively, these low concentrations may reflect differences in its waste stream composition.
The Springfield combustor yielded variable results with two of the last 4 samples meeting the USEPA proposed limit (Figure 3-6).
SEMASS yielded high mercury test results in two samples in 1993 and 1994 but, in general, tested near or below the USEPA proposed emission limit on all other recent tests (Figure 3-12; note that of two samples analyzed in October 1993 one had high and the other very low concentrations of mercury.) The variability in results in 1993 and 1994 may relate to differences in the mercury content of the wastes being combusted (i.e. municipal solid waste streams are not uniform and may vary from day to day depending on the sources of the wastes collected).
Millbury, North Andover and Saugus demonstrate a downward trend in mercury test results since 1988 (Figures 3-9, 3-10, and 3-13, respectively), perhaps reflecting a decreased use of mercury in domestically produced batteries and increased recycling of fluorescent lights and batteries in Massachusetts. Battery collection and recycling programs have been instituted by several MSWCs. Although little data exists on the effectiveness of such battery collection efforts the results noted below suggest that they may be having some limited impact in reducing mercury emissions. For example, battery collection programs have been established in many of the communities serviced by the Millbury facility (operated by Wheelabrator Environmental Systems). Mercury emissions from this MSWC have been trending downward (Figure 3-9). The Springfield Resource Recovery Facility, which has relatively low stack test results, also has an active battery collection program (Figure 3-6). SEMASS will also soon start a battery collection program for the towns and cities it services. Lastly, combustion of lead batteries in MSWC was prohibited by MADEP effective January 1, 1991 by the Department's solid waste regulation 310 CMR 19.017(3). As some lead batteries contain mercury, this regulation may also have contributed to some reduction of mercury entering MSWCs.
In any case, these stack test results suggest that additional efforts to reduce mercury emissions from Massachusetts MSWCs will be needed either through the installation of additional APCDs or by greater efforts to divert mercury containing materials, such as batteries, from the waste stream. Estimates for Overall Emissions of Mercury from Massachusetts MSWCs
The availability of actual stack emission data for mercury from these combustors allowed us to directly estimate mercury air emissions from this class of facilities in Massachusetts. These estimates are presented in Table 3-8, which lists the estimated total mercury emissions for each facility based on average measured stack test data from 1991-1994. These estimates account for the stack gas concentration of mercury and the total volume of stack gases emitted.
We estimate that these facilities have emitted, in aggregate, approximately 6,040 pounds of mercury to the air each year over this period. Because this value is based on actual stack test data, the Department views it as the best currently available estimate of overall MSWC mercury emissions in MA. Emissions ranged from a low of 0.01 tons mercury/year for the Pittsfield, Vicon facility to 1.11 tons mercury/year for the N. Andover-NESWC combustor.
| FACILITY NAME | AVERAGED MEASURED MERCURY (Tons/Year) |
|---|---|
| Agawam-Springfield | 0.08 |
| Haverhill-Ogden | 0.35 |
| Lawrence-Ogden | 0.41 |
| Millbury-Wheelbrator | 0.52 |
| N. Andover-NEWSC | 1.11 |
| Pittsfield-VICON | 0.01 |
| Rochester-SEMASS | 0.11 |
| Saugus-RESCO | 0.43 |
| TOTAL | 3.02 tons (6,040 pounds) |
In addition to stack emissions, some additional release of mercury may occur from incinerator ash and APC waste water. Installed air pollution controls in Massachusetts municipal solid waste combustors vary according to when the facility was initially constructed or required to upgrade. Facilities are equipped to control acid gases pursuant to Chapter 21H, 5(c) of Massachusetts general laws. Existing pollution control devices are very variable in their effectiveness in removing mercury from flue gases. Depending on the precise configuration and operating characteristics of installed APCDs mercury capture efficiencies may vary from less than 10% to as high as 90%. In recent reports, USEPA has assumed a 50% control efficiency for facilities using spray drier (SD) or duct sorbent injection systems combined with fabric filters (FF) or electrostatic precipitators (ESPs) and wet scrubber (WS) systems (USEPA, 1993a; USEPA, 1993b). Depending on precise conditions, the effectiveness of such controls could be much lower to somewhat better than this. Mercury control for other types of APC devices is generally assumed to be much lower ranging from 0-10%.
Six of the nine Massachusetts facilities would fall into the former category (see Table 3-7). This suggests that current MADEP APCD requirements may prevent a significant amount of mercury from being emitted to the atmosphere from these combustors. It also implies that a fraction of the mercury entering these facilities ultimately is captured in fly ash and perhaps APCD waste water. Although some loss of mercury from ash via volatilization, leaching and fugitive emissions undoubtedly occurs, these processes are minimized by MADEP regulations that require disposal of ash to lined landfills with leachate collection and monitoring systems. Depending on how it is handled, disposal of APCD waste water may, however, result in more direct environmental releases of mercury. In any case, assuming a maximal 50% removal efficiency, Massachusetts MSWC ash and APCD liquids would be predicted to contain a maximum of 3 tons of mercury per year.
USEPA has found that existing air pollution control technologies do not adequately control mercury emissions to their newly proposed limit. For example electrostatic precipitator (ESP) controls alone were estimated to be ineffective at removing volatilized mercury from flue gases (USEPA, 1989; USEPA, 1993a). USEPA is now recommending a new combination of control technologies that includes spray drier (SD) or dry sorbent injection (DI), carbon injection and use of a fabric filter or electrostatic precipitator, as the recommended approach for controlling mercury, dioxin and furan emissions (USEPA, 1993a). These combinations have been reported to achieve from 80% to 95% mercury capture and can substantially reduce emissions of mercury into the air. Several of the MA facilities will likely need to upgrade their APCD equipment and/or enhance the collection of mercury containing products from their waste streams in order to meet the new USEPA emission limit.
In any case, the new USEPA emission limit will reduce mercury emissions from these facilities. When all facilities achieve the new limit of 80 µg/dscm, total mercury emissions from these 9 facilities are predicted to decrease by at least 60%. The recently adopted national battery legislation will further reduce mercury emissions. Comparison of Mercury Estimated to Be in Combusted Municipal Solid Waste to Mercury Exiting MSWCs
MADEP estimates that MSWC's release approximately 6,000 pounds of mercury into the environment each year via stack emissions. At most, another 6,000 pounds of mercury and probably considerably less, is captured by the air pollution control devices installed at these facilities. Thus, from approximately 6,000 (a lower bound estimate) to 12,000 (an upper bound estimate) pounds of mercury may exit MSWC's each year. This compares to the estimated 3,180 - 5,639 pounds of mercury estimated to be entering these facilities based on the disposal of mercury containing wastes in the Commonwealth (as summarized earlier and discussed in detail in Appendix F).
As the MSWC emission estimates are, in part, based on actual emission monitoring data, these are viewed as being better overall estimates, suggesting that the MSW calculations may have missed some mercury inputs (e.g. disposed medical wastes?) and/or underestimated others. In any case, the fact that these estimates, derived using two independent methods, are of the same order of magnitude increases our confidence that these results are meaningful approximations of the total amount of mercury from this emission source. Medical Waste Incinerators Background
Medical wastes are defined by the USEPA as "any solid waste which is generated in the diagnosis, treatment or immunization of human beings or animals, in research pertaining thereto, or in the production or testing of biologicals" (USEPA, 1993a). Incinerators are used by many facilities that generate such wastes to render them non infectious (sterilization) and to reduce their volume prior to ultimate landfilling or other disposal. USEPA has estimated
that 3.36 million tons of medical waste are generated each year in the US (USEPA, 1993a). Of this total approximately 0.27 million tons of pathological waste and 1.57 million tons of general medical wastes are processed per year (USEPA, 1993b). Such wastes may contain substantial amounts of mercury. Using emissions determined on a variety of model plants, USEPA has estimated that all US medical waste incinerators (MWIs) emit a total of 64.7 tons of mercury per year into the atmosphere (USEPA, 1993b). Massachusetts Facilities: Monitoring and Emission Information
Since 1960, approximately 216 incinerators have been approved to burn medical and related wastes and other biological materials in Massachusetts (these include hospitals, health care centers, certain laboratories, and some veterinary clinics and crematoria). For a variety of reasons including operating costs, environmental regulations, consolidation of medical provider facilities and the availability of alternative methods for infectious waste sterilization, a number of previously approved incinerators are no longer operating.
At the present time 117 of these approved facilities are listed in the MADEP Division of Air Quality Control Stationary Source Enforcement Inventory System (SSEIS) as being available for use. As the SSEIS data base is not annually updated for small emission sources, MADEP has recently compiled more up-to-date information on the number and operational characteristics of active facilities in the Commonwealth. This information is summarized in Table 3-9.
Based on telephone contacts and written survey's of a total of 121 of the 216 permitted facilities, MADEP estimates that 53 Hospital and Other Health Care Related facility medical waste incinerators are currently in operation or available for use in MA. These facilities are estimated to have an average hourly capacity of 354 pounds of material per facility and to operate, on average, for approximately 2,162 hours per year per facility. Sixteen of these facilities utilize scrubbers.
Operational incinerators located at University, Laboratory and Commercial facilities in MA are estimated to total 22. Seven of these have scrubbers installed. These incinerators have a capacity, on average, of 445 pounds per hour per facility and operate, on average, for approximately 1,517 hours per year per facility.
Approximately 24 Veterinary and Related facilities are estimated to be operational. Scrubbers are generally not in use on these facilities. On average, per facility, these incinerators are estimated to burn approximately 234 pounds of material per hour and to operate for approximately 880 hours per year. As mercury emissions from crematoria are estimated separately (see below) no further discussion of this category is included here.
| Hospitals and Other Health-Care Related | University, Laboratory and Commercial | Veterinary and Related | |
| Total Permitted | 128 | 33 | 35 |
| Average Capacity (lb. of material/hour) | 354 | 445 | 234 |
| Estimated Number of Facilities Active or Available | 53 (16) | 22 (7) | 24 (1) |
| Estimated Average Annual Hours of Operation (per facility) | 2,163 | 1,517 | 880 |
Notes:
Values in parentheses are the number of facilities estimated to be equipped with scrubbers. | |||
Because most medical waste incinerators are small units located at hospitals and other health care facilities, USEPA regulations have not required emissions monitoring for mercury from individual facilities (i.e. individually as opposed to in aggregate these are likely to be small sources of mercury and other pollutants). In order to better define the potential extent of mercury emissions from this source category, MADEP has, however, required emission testing for mercury on four medical waste incinerators in Massachusetts. The results of these tests are presented in Table 3-10, which also identifies the types of APC devices installed at each plant.
| NAME OF FACILITY | EMISSION Rate (µg/sec) |
VOLUMETRIC RATE (dscm/sec) |
AIR POLLUTION CONTROL DEVICE | IN-STACK CONC. (µg/dscm) |
|---|---|---|---|---|
| Clean Harbors | 7.13 | 1.01 | FF/WS | 7.06 |
| Massachusetts General Hospital | 30.19 | 0.629 | VS/PF/WS | 48.0 |
| Boston University Medical Test #1 | 1,329.01 | 3.47 | FF/WS | 383.0 |
| Boston University Medical Test #2 | 6.84 | 2.1 | FF/WS | 3.08 |
| Merrimack Valley Medical Services | 100.62 | 3.49 | FF/WS | 28.83 |
|
FF - Fabric Filter VS - Venturi Scrubber |
WS - Wet Scrubber PF - Particulate Filter |
|||
| Note: The high value reported for the B.U. Medical incinerator during test #1 was attributed by the facility operator to inefficiencies of the APCD attributable to start-up of the facility. During test #2 the APCD equipment was functioning properly. These results are indicative of the potential variability in stack emissions possible from such facilities. | ||||
In these tests, in-stack concentrations of mercury ranged from a low of 3.08 µg mercury/dscm to a high of 383.0 µg mercury/dscm. The considerable variability seen in these data is similar to that reported in other emissions studies of medical waste incinerators and is likely to be attributable to differences in the composition of the wastes burned and the effectiveness of the installed APC devices in capturing mercury. The potential impacts of malfunctioning or poorly maintained APC equipment is illustrated by the greater than 200-fold difference between stack test results at the BU facility.
These results are also graphically displayed in Figure 3-14. The in-stack mercury concentrations at all four incinerators were well below the USEPA proposed limit of 470 µg/dscm for MWIs (this value is based on the Maximum Achievable Control Technology for these types of facilities; for a more detailed discussion of this proposed standard please see Chapter 5, Emission Control Requirement section).
Air Emissions of Total Mercury from Stack Tests of MedicalWaste Incinerators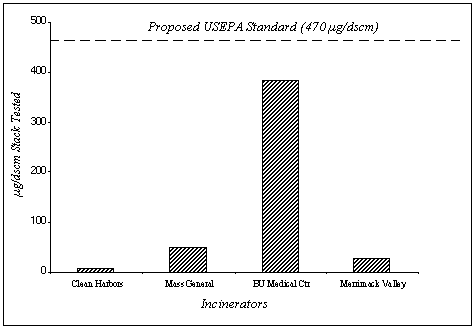 Estimates for Overall Emissions of Mercury from Massachusetts
MWIs
Although individual facilities emit relatively small amounts of mercury the sum total of emissions from all such incinerators in MA may be of concern. Thus, estimates of total mercury emissions from this source category were determined. Because of significant data limitations and many inherent uncertainties, several different approaches were used.
The first approach used was to extrapolate recent USEPA national emission estimates to Massachusetts on a per capita basis. USEPA recently estimated total national emissions of mercury from MWIs to be approximately 64.7 tons based on emission estimates from 8 model facilities (USEPA, 1993b) and assuming that essentially all hospitals operate on-site facilities. In any case, the USEPA national estimate equates to a rate of 4.98 X 10⁻⁴ pounds of mercury per year for each individual in the US (the per capita emission rate; this value is likely to be on the high side since alternative sterilization and disposal practices are becoming more common). This value can be extrapolated to Massachusetts by multiplying by the approximate Massachusetts population of 6 million and applying an adjustment factor of 1.25 to account for the relatively high density of medical and health research facilities in Massachusetts. This yields an estimate of 3,735 pounds of mercury per year for all MWI facilities in Massachusetts. Because many MA medical waste incinerators are no longer in operation this estimate should be viewed as an upper bound or maximal value.
Secondly, emission factors of 0.04 lb. mercury/ton of combusted mixed medical waste and 0.001 lb. of mercury/ton of combusted pathological wastes were used to estimate emissions from medical waste combustion in MA. These emission factors were derived by the USEPA based on test data from six uncontrolled MWI facilities. (USEPA, 1993a). These values were applied to the estimated yearly production of medical wastes in Massachusetts to calculate possible mercury emissions from all Massachusetts MWIs as follows.
Massachusetts mixed and pathological medical waste production were first estimated. Nationally, USEPA estimated that 3.36 million tons of medical waste are generated annually in the US (USEPA, 1993a). USEPA has also estimated that 1.57 million tons of mixed medical wastes and 0.268 million tons of pathological wastes are actually processed per year (USEPA, 1993b). These latter values were extrapolated to Massachusetts using a per person generation estimate of 0.006 tons of mixed medical waste per year and 0.001 tons of pathological waste per year (e.g. 1.57 million tons per year divided by 260 million US population = 0.006 tons per person per year). The total Massachusetts medical waste production was then estimated by multiplying these national per person medical waste generation figures by the Massachusetts population of approximately 6 million to yield a total of 36,000 tons of mixed medical waste and 6,000 tons of pathological waste per year (e.g. 6 million times 0.006 tons per person per year= 36,000 tons of mixed medical waste). These values were next adjusted upward by 25%, to account for the relatively high density of medical and research facilities in Massachusetts, to yield final estimates of 45,000 tons and 7,500 tons of mixed and pathological medical wastes per year, respectively.
Assuming that all of this waste is incinerated in Massachusetts medical waste incinerators, one can apply the USEPA emission factors of 0.04 lb./ton for mixed wastes and 0.001 lb./ton for pathological wastes to yield an overall mercury emission estimate of 1,808 lb. of mercury per year. This is an uncertain estimate because it assumes that all such waste (and only MA waste) is in fact combusted in MA which clearly will not be the case; some will be "exported" for disposal or incineration in other States (emissions from such facilities may none-the-less impact MA via air transport and deposition); some may be imported (Endnote 16); some will be sterilized using steam and then disposed of to lined landfills etc. Overall, taken together, these factors would probably reduce the total amount of medical waste actually combusted in MA by medical waste incinerators and by extension, reduce overall mercury emissions.
The final, and we believe, most accurate approach relied upon results of a MADEP research project, which was as discussed earlier, designed to better estimate the number of operational medical waste incinerator facilities in MA and to better define their current operations. The data from this survey is summarized in Table 3-9. Mercury emissions from hospitals and related health care facilities as well as research, commercial and other facilities was estimated by applying an emission factor of 295 ug mercury/sec of operation, derived from the 5 tests on MA facilities summarized in Table 3-9, to all the facilities equipped with scrubbers (all five MA stack tests were on facilities with scrubbers). For the remaining incinerators an overall estimate of the yearly tonnage of pathological and mixed wastes combusted was calculated and the appropriate EPA emission factors for these waste types for uncontrolled incinerators (see above) was applied. An overall emission estimate for veterinary and related facilities was derived using the EPA emission factors as few are equipped with scrubbers.
Using this approach the following estimates were derived for each category: Hospital and Related Health Care Facilities: 564.6 lb./year; Research, Commercial and Other: 131.3 lb./year; Veterinary and Related: 84.4. Using this refined approach the overall mercury emissions from medical and related waste incinerators in MA equals approximately 780.3 lb./year. This value is considerably lower than that derived using a per capita extrapolation of the USEPA's national mercury emission estimate. The difference is largely due to the closure of many facilities in MA and the resulting alternative disposal of medical wastes (some undoubtedly enters the municipal solid waste stream; mercury air emission from such diversions are captured in this report in the estimates for municipal solid waste incinerators).
| ESTIMATION APPROACH | Hg EMISSION ESTIMATES (pounds/year) |
|---|---|
| Method 1: Extrapolation Based on USEPA National Emission Estimate | 3,735 |
| Method 2: Extrapolation Based on EPA Emission Factors | 1,808 |
| Method 3: Extrapolation Based on Updated MA Data | 780 |
As noted earlier in the discussion of municipal solid waste incinerators, there is also some potential for other releases of mercury into the environment from MWIs attributable to fly and bottom ash and APC materials. These are essentially the same as those identified and discussed previously and would be expected to range from 10% to, at most 50%, of the stack emissions.
To summarize, the three methods used to estimate MA mercury emissions from medical incinerators yield results that vary within a factor of about five: from 780 - 3,735 pounds of mercury per year (Table 3-11) with the lower estimate likely to be most accurate.