| SUMMARY | |||||||||||||||||||||||||||||||||||||||||||||||||||||||||||||||||||||||||||||||||||||||||||||||||||||||||||||||||||||||||||||||||||||||||||||||||||||||||
| The Mercury Reduction Project for the Greater Milwaukee Area
is a joint effort of the Pollution Prevention Partnership, Milwaukee Metropolitan Sewerage
District (MMSD) and Wisconsin Department of Natural
Resources. This Mercury Source Sector Assessment Report is the first result of the
project. The assessment was developed to help set priorities for developing cooperative
mercury education, technical assistance and collection programs. Estimates of the amounts of mercury present, used and/or annually released to air, land and water within the MMSD service area are provided for 25 "source sectors." This 420 square mile area (including Milwaukee County and parts of Waukesha, Racine, Ozaukee and Washington Counties) is home to just over 1 million people. The 25 mercury source sectors evaluated in this report include:
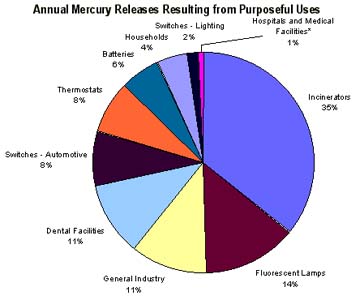
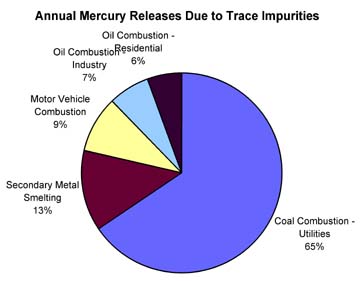
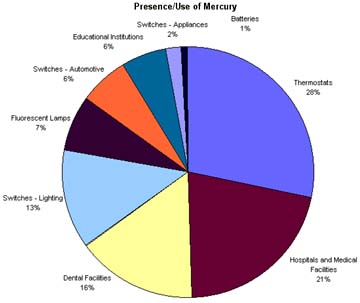
The tables and figures summarize the relative amounts of mercury: These estimates of the amounts of mercury from source sectors are rarely based on actual measurements from the Milwaukee area. More typically, they are based on extrapolating national or statewide estimates of the relative contributions from various mercury sources. For each sector the report utilizes the best information available and applies it to the Milwaukee situation. This Mercury Source Sector Assessment, along with selection criteria developed for the project, should provide a sound basis for developing an effective mercury reduction program.
|
|||||||||||||||||||||||||||||||||||||||||||||||||||||||||||||||||||||||||||||||||||||||||||||||||||||||||||||||||||||||||||||||||||||||||||||||||||||||||
 |
|||||||||||||||||||||||||||||||||||||||||||||||||||||||||||||||||||||||||||||||||||||||||||||||||||||||||||||||||||||||||||||||||||||||||||||||||||||||||
|
This Page created March 11, 1998 |
|||||||||||||||||||||||||||||||||||||||||||||||||||||||||||||||||||||||||||||||||||||||||||||||||||||||||||||||||||||||||||||||||||||||||||||||||||||||||