| Chapter 2 - ANNUAL RELEASES OF MERCURY | ||||||||||||||||||||||||||||||||||||||||||||||||||||||||||||||||||||||||||||||||||||||||||||||||||||||||||||||||||||
| Introduction In this section, tables are provided for the following 21 source sectors:
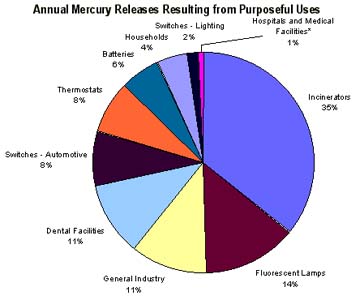
Mercury is used in items such as batteries, switches, thermostats and dental amalgams for its properties. Mercury is an excellent electrical conductor and because it is a liquid at room temperature, has the ability to make and break electrical connections by tilting actions in a smooth and efficient manner. It also has expansion properties similar to the natural materials in teeth, thereby not causing undue stresses due to temperature changes in the mouth from hot and cold foods. Mercury is a naturally occurring element that, because of its ability to amalgamate, or combine, with so many other materials, is found naturally as a trace impurity in several of the fuels that a modern economy uses to obtain energy. This is evident in the mercury releases from coal, oil, gasoline, and diesel combustion. Releases from these source sectors are grouped into two categories: Mercury Releases from Purposeful Uses, which are summarized in Table1 and Figure 2, and Mercury Releases Due to Trace Impurities, summarized in Table 2 and Figure 3.
|
||||||||||||||||||||||||||||||||||||||||||||||||||||||||||||||||||||||||||||||||||||||||||||||||||||||||||||||||||||
 |
||||||||||||||||||||||||||||||||||||||||||||||||||||||||||||||||||||||||||||||||||||||||||||||||||||||||||||||||||||
|
||||||||||||||||||||||||||||||||||||||||||||||||||||||||||||||||||||||||||||||||||||||||||||||||||||||||||||||||||||
Figure 3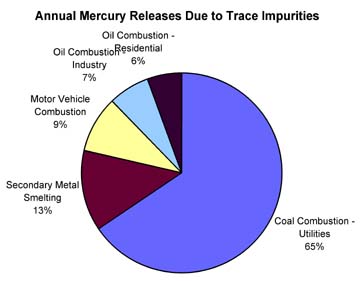 |
||||||||||||||||||||||||||||||||||||||||||||||||||||||||||||||||||||||||||||||||||||||||||||||||||||||||||||||||||||
| Release documents
available here as an Adobe portable document file, (490Kb) |
||||||||||||||||||||||||||||||||||||||||||||||||||||||||||||||||||||||||||||||||||||||||||||||||||||||||||||||||||||
| about pdf files | |
|||||||||||||||||||||||||||||||||||||||||||||||||||||||||||||||||||||||||||||||||||||||||||||||||||||||||||||||||||
|
This Page created March 11, 1998 |
||||||||||||||||||||||||||||||||||||||||||||||||||||||||||||||||||||||||||||||||||||||||||||||||||||||||||||||||||||