Chapter two presented general information on the technologies that could be used for separating VOC's from aqueous waste streams and chapter five indicated where modeling equations for these technologies can be located. These chapters provide the background information needed to design a separation system for VOC aqueous wastes. This chapter will provide the designer with a systematic approach for identifying the VOC separation system possessing the minimum total annualized cost to the company.
Process synthesis tools provide a systematic framework for tackling numerous process design tasks. Several generic process design tools have been developed to date but two are particularly applicable to the design of VOC separation systems for aqueous wastes. These tools are the Design of Mass-Exchange Networks and the Design of Membrane Systems.
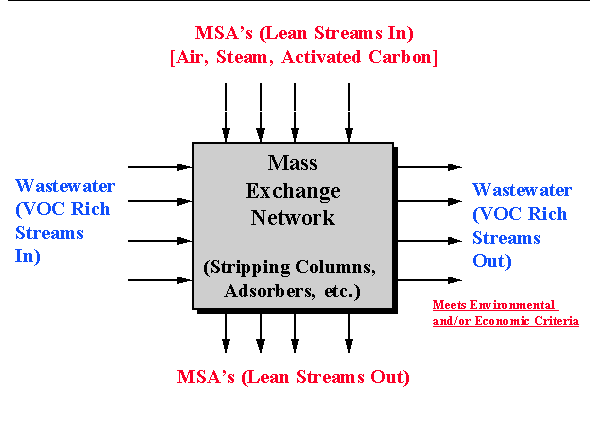
The design of mass-exchange networks (called "MEN's") was one of the first concepts developed to systematically identify the cost effective network of process units that accomplish a desired separation task. This design concept was introduced by El-Halwagi and Manousiouthakis in 1989, 1990 and this methodology will be discussed relative to the design of separation systems for VOC aqueous wastes. For the aqueous VOC problem, the designer has a number of waste streams that have a higher concentration of VOC than is acceptable. It is desired to contact these streams with one or more mass separating agents (called MSA's) within mass exchangers to transfer the VOC from the aqueous streams to the MSA(s). This design methodology can be used for the synthesis of direct contact mass-transfer processes. For the aqueous VOC separation task, air stripping, steam stripping and carbon adsorption fall under this category and these units are examples of "mass exchangers." Therefore, the mass separating agents or MSA's are respectively air, steam and activated carbon for these processes. In general, the problem statement for the design of MEN's as it applies to aqueous VOC streams can be summarized as follows: Given a number of aqueous VOC streams, synthesize a network of mass-exchangers (strippers, adsorbers) that can transfer the VOC from the wastewater to an MSA(s) at minimum cost. A schematic representation of the VOC separation task is shown below as Figure 6.1.

A useful tool introduced for this design methodology is the Mass Exchange Pinch Diagram. It is a graphical tool that allows a one-to-one correspondence between all wastewater streams and all process MSA's. This tool can be used to minimize the cost of MSA's by maximizing the use of any internal process streams that are available for the separation task.
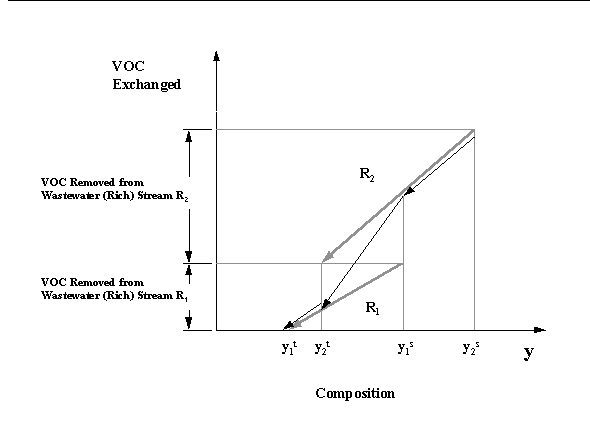
The first step in this approach is to establish several composition scales, one for all of the wastewater streams and one for each process MSA (air, steam, activated carbon). that are in one-to-one correspondence according to their equilibrium relationships with an added composition driving force for mass transfer. Next, the mass exchanged by each wastewater stream is plotted versus its composition scale. Hence, each wastewater stream is represented as an arrow whose tail corresponds to its supply composition and its head corresponds to its target composition. The slope of each arrow denotes the stream flowrate. After the individual streams are plotted, the designer can then construct the composite streams. A composite wastewater (rich) stream represents the cumulative mass of the pollutant lost by all the wastewater streams. It can be readily obtained by using the "diagonal rule" for superposition to add up mass in the overlapped regions of streams. Hence, the wastewater composite stream is obtained by applying superposition to as illustrated in Figure 6.2.

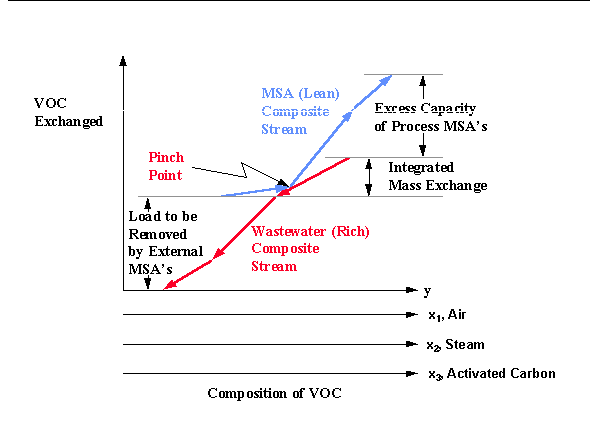
Similarly, the lean composite stream is constructed by employing linear superposition to all the internal process streams (called process MSA's) that could be used for the separation task. Next, both composite streams are plotted on the same diagram. On this diagram, thermodynamic feasibility of mass exchange is guaranteed when the lean composite stream is always above the waste composite stream. This is equivalent to ensuring that at any mass-exchange level (which corresponds to a horizontal line), the composition of the lean composite stream is located to the left of the waste composite stream, thereby asserting thermodynamic feasibility. Hence, the lean composite stream can be moved vertically until it touches the waste composite stream as shown on the figure 6.3.

The point where the two composite streams touch is called the "mass-exchange pinch point" and, hence, the name "pinch diagram" (Figure 6.3). On the pinch diagram, the vertical overlap between the two composite streams represents the maximum feasible amount of the VOC that can be transferred from the wastewater streams to the process MSA's. It is referred to as the "integrated mass exchange." The vertical distance of the lean composite stream which lies above the upper end of the waste composite stream is referred to as "excess process MSA's." It corresponds to that capacity of the process MSA's to remove pollutants which cannot be used because of thermodynamic infeasibility. According to the designer's preference or to the specific circumstances of the process such excess can be eliminated from service by lowering the flowrate and/or the outlet composition of one or more of the process MSA's. Finally, the vertical distance of the waste composite stream which lies below the lower end of the lean composite stream corresponds to the mass of pollutant to be removed by external MSA's. External MSA's can then be screened based on the cost of each external MSA per unit mass of VOC removed.
Two membrane technologies, reverse osmosis and pervaporation, were cited for their potential in aqueous VOC separations. Designing a membrane-separation network for aqueous VOC streams requires the identification of membrane types, sizes, number and arrangement. The designer must also determine the optimal operating conditions and the type, number and size of any pumps and energy-recovery devices. A systematic methodology for the design of membrane separation systems is based on minimizing the total annualized cost of the system (El-Halwagi, 1992; Srinivas and El-Halwagi, 1993). This objective is subject to thermodynamic equilibrium constraints and technical constraints (material balances, energy balances, modeling equations, etc.). The problem is formulated as a mathematical program whose solution identifies the type, size and arrangement of all process units in addition to the optimal flowrates and separation loads.
It is also worth pointing out that the aqueous VOC network may involve hybrid systems that include more than one type of separation technologies. The synergism among various processes can provide major technical and economic benefits. Some research has been undertaken to integrate mass-exchange and membrane units (El-Halwagi, 1993), mass-exchange and heat-induced operations (Stanley and El-Halwagi, 1993) as well as mass-exchange and biological-treatment systems (El-Halwagi et al., 1992) to address the synergism between technologies employed for the separation task.
An ethylene/ethylbenzene manufacturing plant has two wastewater emission streams. The first wastewater stream, designated R1, is the quench water recycle stream for the cooling tower. The second wastewater stream, designated R2, is the wastewater from the ethylbenzene portion of the plant. Benzene must be removed from stream R1 prior to its recycle back to the cooling tower. Benzene must be reoved from stream R2 prior to sending this stream to biotreatment. Table 6.1 is included as a summary of the wastewater stream data.
| Stream | Description | Flowrate (kg/s) | Supply Composition (ppm) | Target Composition (ppm) | Stream Disposition |
| R1 | Wastewater from Settling | 80 | 800 | 150 | Recycled to Cooling Tower |
| R2 | Wastewater from Ethylbenzene Separation | 140 | 1500 | 300 | Biotreatment |
Continue to Second Part of Chapter VI