Chapter I
STUDY APPROACH AND METHODOLOGY INTRODUCTION
A resource and environmental profile analysis (REPA), such as this study, quantifies the energy use and environmental emissions associated with the manufacture, use and disposal of specific products. This background information can be used as the basis for further study of the potential improvement of resource use and environmental effects associated with a given product. It can also pinpoint areas where process or product changes would be most beneficial in terms of reducing energy use or emissions. The unique feature of this type of analysis is its focus on the entire life of a product, from raw material extraction to final disposition, rather than on a single manufacturing step or environmental emission. Figure 1-1 illustrates the general approach used in this analysis.
Resource and environmental profile analyses have been performed by Franklin Associates Ltd. since the early 1970s, both domestically and internationally. They are an example of what has recently been called an environmental life cycle analysis. These studies have been prepared by Franklin Associates for a wide range of clients representing a wide range of interests. These include the U.S. Environmental Protection Agency (EPA), Federal Energy Administration, National Science Foundation, The Aluminum Association, The Society of The Plastics Industry, and the American Paper Institute.
PURPOSE
The purpose of this study is to assess the energy requirements and environmental emissions for manufacture, use, and disposal of a manufactured fiber product. Specifically, the study evaluates the life cycle of a knit polyester blouse. The term "system" in this study is defined as the blouse itself plus all primary and secondary packaging components. The analysis involves all steps in the life cycle of each system, including extraction of raw materials from the earth, processing these materials into usable components, fabric production, apparel manufacture, transportation of materials and products to the next processing step, blouse laundry, and final disposition.Resource and environmental profile analyses (REPAs) such as this study are defined by the Society of Environmental Toxicology and Chemistry (SETAQ as life cycle inventories. SETAC and the U.S. Environmental Protection Agency define life cycle analysis as being composed of three separate but interrelated components: life cycle inventory, life cycle impact analysis, and life cycle improvement analysis. This analysis is an inventory analysis and not an impact analysis or a risk assessment. Risk assessment is an attempt to determine the human health effects or ecological effects associated with a given material or product. At present, there is no accepted method for performing meaningful risk assessment on a life cycle basis.
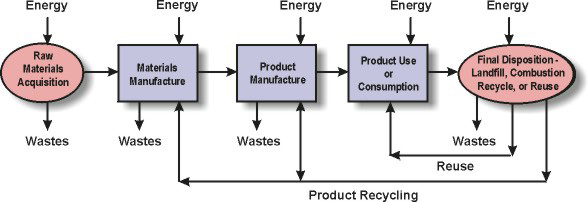
- Figure 1-1. General materials flow for "cradle-to-grave" analysis of a product system.
METHODOLOGY
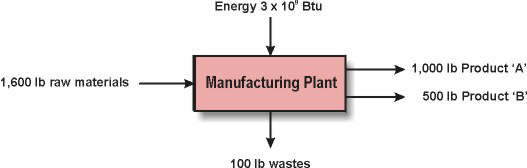
Franklin Associates, Ltd. has developed a methodology for performing resource and environmental profile analyses. This methodology has been documented for the U.S. Environmental Protection Agency and is incorporated in the EPA report Life-cycle Assessment Inventory Guidelines and Principles. The methodology is also consistent with the life cycle inventory methodology described in A Technical Framework for Life-cycle Assessment, a workshop report produced by the Society of Environmental Toxicology and Chemistry. These are the customary peer-reviewed reference documents on this subject. The data presented in this report were developed using this methodology, which has been in common use for over two decades.The first step in performing a REPA is to determine which specific manufacturing processes must be evaluated. A complete materials balance is then performed for each individual process. A standard unit of output, such as 1,000 pounds, is used as the basis for all calculations. Energy requirements and emissions are determined for each process and expressed in terms of the standard unit of output. If marketable coproducts or byproducts are produced, adjustments are made in the materials balance, energy requirements, and emissions to reflect the portion of each attributable to the product being considered. Figure 1-2 illustrates a common adjustment concept. The data appendices accompanying this report detail the data collected for this research analysis.
Once the detailed material balance, energy requirements, and environmental emissions have been established for 1,000 pounds of output for each process of a system, a master flow (Figure 1-3) chart is made. This flow chart shows the raw materials from each process that are required to manufacture the blouse system components.
The quantities of energy and solid wastes which result from the entire life cycle have been totaled in this study. The various types of energy are converted to British thermal units (Btu) and added. Solid wastes are also totaled and presented in both pounds and cubic feet of waste. The individual categories of atmospheric and waterborne emissions have not been totaled because it is widely recognized that various substances emitted to the air and water differ greatly in their effect on the environment.
Actual process flow diagram.
- Using coproduct allocation, the flow diagram utilized in the REPA for product 'A', which accounts for 2/3 of the output, would be as shown below.
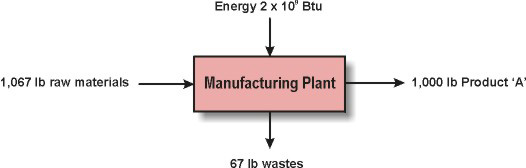
- Figure 1-2. Flow diagrams illustrating coproduct allocation for product 'A'.
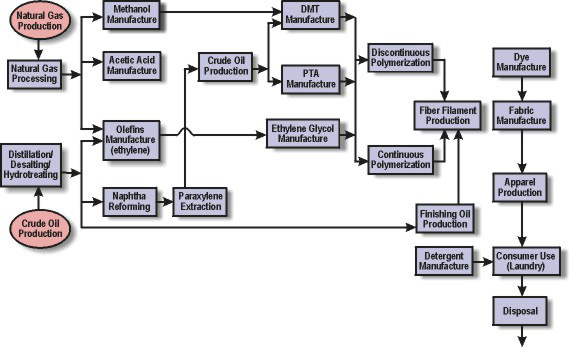
- Figure 1-3. Flow diagram for the manufacture, consumer use, and disposal of a woman's knit polyester blouse.
PRODUCT EXAMINED
In order to provide AFMA member companies with a better understanding of the benefits of the product life cycle analysis methodology, a common manufactured product was chosen as the basis for this research project. Specifically, this research effort focused upon the life cycle analysis of a woman's polyester blouse. The results of the study were normalized to a basis of one million wearings of blouses. Table 2-1 describes the specific blouse examined.DATA SOURCES
Over the past 20 years, Franklin Associates has performed over 150 REPA studies which have examined the energy requirements and emissions associated with the manufacture and use of a variety of products and packaging materials. Therefore, many of the basic industry descriptions, raw materials requirements, and data for packaging components from previous studies are used as a starting point for this analysis. The primary sources used for the necessary revisions to our existing database are technical literature, government publications, published industry statistics, and personal interviews with industry representatives.DATA GATHERING
Data gathering involved analyzing data needs in several life cycle steps. The results of this analysis are grouped according to these "steps." A discussion of operations included in each of these steps can be found in Table 1-1. For this study, project specific data requirements necessitated revisions for the following processes: resin manufacture, fiber production, dye manufacture, fabric production, apparel production, consumer use (laundry), and disposal options. The following narrative describes data gathering in each of these areas.Resin Manufacture
Polyester resin data were collected from AFMA member companies. Both Dimethyl terephthalate (DMT) and purified terephthalic acid (PTA) processes were included as were continuous and discontinuous operations. Once all data were gathered, market share information provided by AFMA was used in developing composite resin data. The difficulty of gathering data for resin manufacture was in identifying the appropriate company contacts.
Table 1-1
PROCESS
STEPS TO BE EXAMINED
| PET Resin Manufacture | all operations from gas and oil extraction to resin production, including transportation and packaging between operations | |
| PET Fiber Manufacture | all operations after resin manufacture to production of filament fiber for shipment to fabric mill, including transportation | |
| PET Fiber Packaging | all operations to produce and transport all packaging materials shipped with fiber to fabric mill - primarily corrugated, plastic wrap, and wood. | |
| Dye Manufacture | all operations to produce disperse blue 79:1, including transportation and packaging to the fabric mill | |
| Fabric Manufacture | texturizing, knitting, dyeing, and finishing operations, including transportation between operations | |
| Fabric Packaging | manufacture of packaging to transport fabric to apparel operations | |
| Detergent Manufacture | manufacture and transportation of detergent components | |
| Detergent Packaging | manufacture of consumer detergent packaging | |
| Laundry | required home laundry operations (washing, drying, and water heating) | |
| Postconsumer Disposal | operations for the disposal of municipal solid waste (transportation to landfill or combustion facility) |
Fiber Manufacture
Polyester filament fiber data were collected from AFMA member companies. The data collection process was very similar to collecting resin data. Questions arose as to where resin manufacture ends and fiber production starts.Fabric Manufacture
Most of the fabric manufacturing data used in this study were extracted from research conducted by the Institute of Textile Technology in Charlottesville Virginia. The data represent the "generic" manufacture of fabric from manufactured fiber. The data were in most cases a general representation of all fabric production operations and not task specific (texturizing, knitting, dyeing, and finishing). The environmental data were also generalized plant data and in some cases dated from the mid-1970s. The dyeing process emission data likely included other dyes besides the blue dye specifically analyzed in this study. Very little data were available from the trade association representing this industry, American Textile Manufacturers Institute.Dye Manufacture
Dye manufacturing data were provided by ETAD (Ecological and Toxicological Association of the Dyestuff Manufacturing Industry) as representative for the production of disperse blue 79:1. This data were specific to this particular blue dye and would not apply to other possible colors or types of dye.Apparel Manufacture
Data were developed by Franklin Associates from confidential apparel industry sources. The trade association representing this industry, American Apparel Manufacturers Association, does not currently collect data relevant to this study. The apparel manufacturing process is a very technologically diverse industry and is difficult to assimilate into a single "average" value. Fortunately, the impacts from this operation are small and the limited data sources are not viewed as a major problem.Consumer Use
The major consumer use processes are home laundry (wash, dry, hot water heating) and detergent manufacture. For this study, new research was conducted in the areas of washing temperature, load size, and dryer time. For load size and dryer time, the data gathered indicated much variability based on operator preferences /habits. Because these operations have such a large contribution to this life cycle analysis study, it is suggested that additional research be conducted to better document data in these areas.Blouse Disposal Options
As will be discussed in detail later in this chapter, discarded textile products are often reused or recycled. However, documented data sources identifying the quantities of apparel products diverted from the waste stream do not exist. This analysis chose to focus on manufacturing and consumer use and consequently, did not evaluate options other than landfilling and combustion. A more in-depth analysis of waste management options may be useful in attempting to identify alternative uses for waste apparel products.RELIABILITY OF RESULTS
An important issue in considering the use of this study is the reliability of the calculations. In a complex study with literally thousands of numbers, the accuracy of the data and how it affects conclusions is truly a complex subject, and one that does not lend itself easily to standard error analysis techniques. However, the reliability of the study can be assessed in other ways.An important consideration is whether the conclusions are correct. For example, a specific conclusion depends on the accuracy of the numbers that were combined to arrive at that conclusion. There are several subsystems in the blouse system, so there are several numbers added together to arrive at the total values. Each number by itself contributes little to the total, so the accuracy of each number by itself has a small impact on the overall accuracy of the total. The best available numbers have been used in this study; however, there is no analytical method for assessing the accuracy of each number to any degree of confidence. In many cases, plant personnel reported actual plant data. The data reported may represent operations for the previous year or may be representative of the upcoming year. All data are scrutinized when they are received to evaluate whether or not they are representative of the type of operation or process being evaluated. The data used in this report are the best which can be found at this time.
There are several other important points with regard to data accuracy. Each number contributes very little to the total value, so a large error in one data point does not necessarily create a problem. It is assumed that with careful scrutiny of the data any errors will be random. That is, some numbers will be a little high due to errors, and some will be slightly low, but in the summing process these errors cancel out. For subprocesses that make a larger than average contribution to the total, special care is taken with the data quality.
REPA data are not amenable to standard statistical analysis. Appendix I presents approximate rules for judging whether conclusions can or cannot be reached using REPA results, based upon our knowledge of error and variability of the data. The rule suggested is that if system totals of energy or postconsumer solid waste (by weight) for two product systems differ by 10 percent or more, we are 95 percent confident that the difference is significant. By this we mean that if other LCA practitioners performed this study using the same methodology and sampled the same populations, we are 95 percent confident that they would arrive at the same conclusion. However, the error and variability of other emission data (industrial solid waste, atmospheric emissions and waterborne wastes) is much greater, suggesting that significant differences exist only if the differences exceed 25 percent.
There is another dimension to the reliability of the data. Certain numbers do not stand alone, but rather affect several numbers in the system. An example is the weight of the garment. This number is multiplied by every number related to a change in the garment weight. Consequently, a change in garment weight could cause very different results for this study.
Another issue is the variability of common practice. This study reports average, or typical, behavior and therefore does not apply to individual actions that deviate from the norm. Also, a particular set of material suppliers was used to provide data for this study. If a different set of suppliers is used to develop the average data, the average data might vary enough to affect the results of the report.
In summary, for the particular data sources used and for the specific methodology described in this report, the reliability of the results of this report is good. However, using this study to make decisions in specific cases which may differ significantly from those described here may lead to erroneous conclusions.
ENERGY REQUIREMENTS
The average energy requirements for each industrial process are first quantified in terms of fuel or electricity units such as cubic feet of natural gas, gallons of diesel fuel, or kilowatt-hours (kwh) of electricity. Transportation requirements are developed in the conventional units of ton-miles by each transport mode (e.g. truck, rail, barge, etc.). Statistical data for the average efficiency of each transportation mode are used to convert from ton-miles to fuel consumption. The data for these conversions are presented in Appendix A of this report.Once the fuel consumption for each industrial process and transportation step is quantified, the fuel units are converted to Btu using the conversion factors shown in Appendix A. These conversion factors have been developed to account for the energy required to extract, transport, and process the fuels and to account for the energy content of the fuels. The energy to extract, transport, and process fuels into a usable form is labeled precombustion energy. For electricity, precombustion energy calculations include adjustments for the average efficiency of conversion of fuel to electricity, and for transmission losses in power lines.
The REPA methodology assigns raw materials that are derived from fossil fuels with the fuel-energy equivalent. Therefore, the total energy requirement for coal, natural gas, or petroleum-based raw materials includes the fuel energy of the material (called energy of material resource or inherent energy). For example, this energy allocation would be applied to plastics of which natural gas and petroleum are the primary material resources. No fuel-energy equivalent is assigned to combustible materials, such as wood, that are not major fuel sources in this country.
The Btu values for fuels and electricity consumed in each industrial process are summed and categorized into an energy profile according to the six basic energy sources listed below: