
WATER: OPTIMIZING PERFORMANCE WHILE REDUCING WASTE
Glen Almond
Department of Farm Animal Health & Resource Management
North Carolina State University
Raleigh, NC 27606
Introduction
Due to the relative abundance of water and its �low price�, there previously was little demand for research on the role of water and water delivery systems in US pork production, and specifically with applications to North Carolina. In contrast, several European countries consider water as a critical nutrient and a valuable resource, and their researchers aggressively conducted studies on water delivery systems and factors affecting water consumption and waste (Mroz et al., 1995). Water is important in pork production for two general reasons: its role in pig performance and its contribution to waste.
On swine farms, the three primary categories of water use include drinking, sanitation, and cooling. Water consumption by animals is typically based on published requirements for a particular age group or weight of pig; it is assumed that the population of pigs consumes a specific quantity of water each day. Some reports indicated that 40% of water use is attributable to sanitation and washing procedures. In general, this percentage appears to be an overestimate and presumably the quantity will vary between farms and type of facility. High-pressure sprayers and free water hoses are commonly used for washing and disinfection. The high-pressure sprayers use between 4 and 8 gallons/min. For 8 hours of use, the sprayers use less than 4000 gallons of water. One report indicated that the high-pressure sprayers use 20% less water the free water hoses. The quantity of water used for soaking rooms, prior to pressure washing, has not bee quantitated, but may be extrapolated from values provided for sprinkler nozzles.
Cooling devices, such as misters, cool cells and drippers use water on a seasonal basis. Their contribution to wastewater and specifics of operation of cooling devices are well described in the Pork Industry Handbook (Article PIH-87). Our studies have failed to consistently reveal seasonal trends in water use by sow farms. Either the sprinkler systems and evaporative coolers are very efficient, or conversely, their contribution to a farm�s overall water use is negligible.
Water Requirements
Water is the single nutrient required in the greatest quantity by animals. Pigs require water for a variety of reasons, including most metabolic functions, adjustment of body temperature, movement of nutrients into the body tissues, removal of metabolic waste, production of milk, and for growth and reproduction. In fact, 80% of the empty body weight of the newborn pig and about 50% of a market hog is water. An animal can lose practically all its fat and over half of its protein and yet live, while a loss of one-tenth of its water results in death.
Pigs consume the majority of their water by drinking. However, some water is ingested in feed and metabolism also generates water. The pig loses body water via urine, feces, respiration and from the skin. The balance between water intake and water loss is affected by numerous factors including health status, nutrition and the environment. There is not a simple answer to the question "How much water do pigs need?� Surprisingly, few studies have directly addressed the question and many investigations erroneously equate water use or water consumption with water requirements.
Daily water intake by lactating sows ranges from 8 to 25 liters (2-6.6 gals; Phillips et al., 1990; Fraser et al., 1990). It was recommended that 3.5 to 6 gals of water be provided daily to nonlactating sows (Midwest Plan Service, 1983; Madec, 1984; Gardner et al., 1990). Several studies indicated that gestating/breeding sows actually consume between 2 to 4 gals of fresh water/day (Madec et al., 1986; Phillips et al., 1990; Klopfenstein et al., 1994) while gilts consume 1.5-3 gals/day (Madec et al., 1986; Jourquin et al., 1992).
It is necessary to recognize that there is no single water requirement for a species or an individual; the amount of water consumed depends upon factors such as temperature, diet, frequency with which water is provided, housing and stresses in the environment. In general, the water requirements of grow-finish pigs typically is related to feed intake and expressed as a ration of water:feed. This ratio may range from 2:1 to 3.5:1, depending on the study. In regard to the optimal ratio for performance, several factors may be important and most studies fail to report similar results.
A summary of reported water requirements of the pig are provided in Table 1.These values are based on the requirements of pigs in a thermoneutral environment and under ideal conditions. It is difficult to maintain pigs in such favorable conditions in commercial farms.
Table 1. Water requirements of pigs. Values (liters/day or gallons/day) indicate the range of
requirements as presented in the literature.
|
Class of Pig |
Liters/pig/day |
Gallons/pig/day |
|
Nursery pigs (up to 60 lbs BW) |
2.8 2.5-3.0 L/kg of feed consumed |
0.7 0.3 gal/lb of feed consumed |
|
Grower Pigs (60 -100 lbs BW) |
8-12 2.5-3.0 L/kg of feed consumed |
2-3 0.3 gal/lb of feed consumed |
|
Finishing Pigs (100 - 250 lbs BW) |
12-20 2.5-3.0 L/kg of feed consumed |
3-5 0.3 gal/lb of feed consumed |
|
Nonpregnant gilts |
12 |
3 |
|
Pregnant sows |
12-25 |
3-6 |
|
Lactating sows |
10-30 |
2.5-7 |
|
Boars |
20??? |
5?? |
Factors Affecting Water Requirements and Intake
Pigs affected with diseases require more water than healthy pigs of the same age and body weight. For example, water loss associated with diarrhea or increased water demands of an animal with a fever change the water requirements of a sick pig. Increased water intake is difficult for a pig to achieve in large pens with numerous pigs or when water supply is intentionally restricted by certain water delivery systems.
Water demand will increase in proportion to the crude protein of the diet. Thus, 3.9 and 5.3 liters of water were consumed daily by nursery pigs fed 12 or 16% crude protein diets, respectively. The influence of added artificial lysine to the diet on water intake has not been addressed and unpublished studies indicate that pigs consuming a pellet ration have greater water demands than pigs eating a diet fed as meal. Higher salt or potassium intake increases the demand for water. "Salt poisoning" is not generally a result of a toxic level of salt intake per se, but a disruption of the pig's water balance (ie, a disruption of water supply). Water starvation is more appropriate to describe this condition.
High ambient temperatures will increase water requirements, particularly in sows and finishing pigs. The increased consumption coupled with increased urinary water loss is an effective mechanism by which pigs lose body heat. A change in ambient temperature from 54-600F to 86-950F gives an increase of >50% in water consumption. When pigs are fed ad libitum, a reduction in feed intake is a typical response to high temperatures. The decreased feed intake lowers the animals' need to eliminate metabolic heat. Fortunately, the diurnal pattern of high ambient temperatures allows pigs to consume feed during the cooler parts of the day. One interesting observation is that at high ambient temperatures, pigs will consume almost double the quantity of cool (500F) water than the amount of warm (800F) water.
It is an accepted industry procedure to provide 4-6 lbs of feed to gestating sows. This restricted feed intake is usually matched by increased water intake (assuming sufficient water is available). The extra water intake is presumed to occur by the animals' attempts to gain abdominal fill (Yang et al., 1984). For most sows, 60-75% of water is consumed within 3-4 hours after feeding; however, many sows consume water throughout the day (Klopfenstein et al., 1994; Mroz et al., 1995). Therefore, a constant source of water is required in breeding and gestation barns.
Sow Health
Some of the most common health problems in commercial sow farms are urinary tract infections. Urinary tract infections include cystitis (inflammation of the urinary bladder) and pyelonephritis (inflammation of the kidney). Reports indicated that urinary tract infections affected 22 to 40% of sows in confinement operations (Madec, 1984; Wendt and Vesper, 1992). The negative impact of these infections on sow herds is illustrated by the observation that the proportion of sow deaths attributable to cystitis-pyelonephritis varies from 15% to greater than 40% (Smith, 1984; D'Allaire et al., 1991).
Various bacterial agents were isolated from cases of cystitis-pyelonephritis, including Escherichia coli, Proteus spp., Streptococusi sp., Staphylococcus spp. and Eubacterium suis. It is common to note mixed infections with the aforementioned bacteria. Several contributory factors have been associated with cystitis-pyelonephritis in sows. Age, lack of exercise (Madec and David, 1983) and the use of stalls or tethers increase the likelihood of cystitis and pyelonephritis. Water intake presumably is the most important risk factor in cystitis-pyelonephritis (Madec et al., 1986; Bollwhan and Arnhofer, 1989).
Various water delivery systems are used in sow facilities, but the impact of these systems on sow health and performance received little attention. This shortcoming was due to the lack of a practical, diagnostic technique that could be used to evaluate sow health without conducting necropsies on dead sows. Therefore, we established practical urinalysis procedures for evaluation of urinary tract infections in sows (Almond and Stevens, 1995; John Carr � personal communication). The collection of urine samples is usually non-invasive and easily performed on farms. Urinalysis results provide important information regarding hydration status (water intake) of animals, the severity of inflammation in the urinary bladder and/or kidneys, and with the appropriate microbial cultures, the likely pathogen(s).
Field Investigation
The first study was conducted to evaluate the effect of water delivery system on urinalysis values for gestating sows during the summer months. The results showed that the prevalence of urinary tract infections in sows was dependent on the type of water delivery system (Table 2).
Specific gravity and urine abnormalities (presence of protein, nitrite, white blood cells) were less in samples collected from sows using nipple drinkers in the gestation crates than sows using the other delivery systems. The results revealed that urine specific gravity was greater than 1.020 in 30% of sows using an intermittent water delivery in gestation stalls. In contrast, less than 3% of sows had a urine specific gravity greater than 1.020 when the sows had access to a water nipple in each gestation stall. Overall, the results indicated that many gestating sows are at risk of urinary tract infections, particularly when housed in stalls with intermittent delivery of water in a trough. Further, the high specific gravity of these sows is a clear indication that many of the sows had restricted access to water.
Table 2. Effect of water delivery system on urine abnormalities in gestating sows. Type 1system has water nipples in individual gestation crates; Type 2 had two nipples in gestation pens (5-6 animals/pen); Type 3 is crate gestation with a common water trough, filled three times/day; Type 4 is crate gestation with a common sloped water trough with water supplied for 15 min at 2-h intervals.
|
|
Delivery System (n = 4-5 farms/system) | |||
|
Parameter |
Type 1 |
Type 2 |
Type 3 |
Type 4 |
|
No. Samples Collected |
201 |
135 |
200 |
230 |
|
Specific Gravitya |
1.006+.0016c |
1.014+.002e |
1.009+.001d |
1.015+.002e |
|
pH |
6.93 + .2 |
6.76 + .2 |
6.91 + .2 |
7.3 + .2 |
|
Proteinb |
.085 + .12 c |
.35 + .16 d |
.22 + .12 cd |
.9 + .12 e |
|
% Samples with Abnormalities |
15.4 |
60.7 |
53.5 |
63.9 |
|
% Samples with > 105 colonies bacteria/ml |
12.4 |
41.5 |
41 |
43.5 |
|
a Urine specific gravity is a measurement of urine concentration. Specific gravity of water is 1.000. As specific gravity increases, the urine �concentration� also is increasing. b Using urine reagent strips, scores of 0, 1, 2, and 3 were assigned to correspond to urine samples that tested negative for protein, or tested positive for trace amounts of protein, 30 mg protein/dl and 100 mg protein/dl respectively. c,d,e Means within a row with different superscripts differ (P<.01). | ||||
Field Investigation - Water Use in Each Stage of Production:
To further evaluate water use, we conducted a 12-month study on two commercial farms. Weekly water use (intended for consumption) was recorded for each phase of production. The results provide useful indicators of anticipated water use for new farms or farms in the process of remodeling. Water used for cleaning or for evaporative cooling was not assessed.
Breeding/Gestation: Table 3 illustrates the daily water use (gallons/sow/day) by gestating sows. Three water delivery systems were included. During the first 40 weeks, there was a clear pattern of water use. In contrast, water use during the summer months (Weeks 41-52) was erratic. Additional information is provided in Table 3.
Table 3. Water use by three water delivery systems in a gestation facility. The 52-week study was conducted for one year (September 1997-September 1998). Water use and animal inventory were recorded weekly. The study was divided into three periods of time, based on distinct water use patterns. Overall represents the entire 52-week study.
|
Time Period |
System |
No. of Sows |
Gallons/Sow/Day |
Gallons/Crate/Day | |||
Mean |
STD |
Mean |
STD |
Mean |
STD | ||
Week 1-22 |
Arato |
198.9 |
6.4 |
2.24 |
0.5 |
2.18 |
0.5 |
|
|
Nipple |
187.5 |
4.3 |
3.09 |
0.4 |
3.01 |
0.4 |
|
|
Trough |
262.8 |
7.8 |
8.03 |
1.0 |
7.9 |
1.0 |
|
Week 23-40 |
Arato |
199.9 |
4.8 |
2.87 |
0.6 |
2.8 |
0.6 |
|
|
Nipple |
185.94 |
8.5 |
2.7 |
0.8 |
2.6 |
0.7 |
|
|
Trough |
265.1 |
4.4 |
4.37 |
0.2 |
4.32 |
0.2 |
|
Week 41-52 |
Arato |
201.4 |
1.8 |
4.2 |
1.6 |
4.23 |
1.6 |
|
|
Nipple |
190.25 |
1.8 |
5.7 |
2.5 |
5.64 |
2.5 |
|
|
Trough |
262 |
5.9 |
6.74 |
3.1 |
6.61 |
3.1 |
|
Overall |
Arato |
199.83 |
5.1 |
2.93 |
1.2 |
2.87 |
1.2 |
|
|
Nipple |
187.6 |
5.9 |
3.54 |
1.74 |
3.5 |
1.7 |
|
|
Trough |
263.4 |
6.4 |
6.46 |
2.25 |
6.35 |
2.2 |
In the last 12 weeks of the study, irregular peaks in water use were noted with each system. The primary reason for the erratic patterns was the discharging of fresh water into the troughs in the rows of crates with nipple and Arato drinkers. Because the increased water use was irregular during this time, it is assumed that timers were not used for the trough delivery. The justification for the use of troughs, despite the nipple and Arato drinkers, was not provided. Unfortunately, the erratic use of troughs in both barns interfered with statistical analyses and subsequent interpretation.
Flow rates of randomly selected Arato drinkers and nipple drinkers were determined at 3-4 week intervals from December 1997 to August 1998. Figure 1 illustrates the flow rates of Arato and nipple drinkers in the breeding/gestation facilities. The mean flow rate for the nipple drinkers was approximately 1500 ml/min. The flow rate was 600 ml/min by Arato drinkers. It should be noted that there was minimal variation in flow rates by the Arato drinkers. In contrast, flow rates varied between the different nipple drinkers and the flow rate of each nipple drinker was inconsistent.
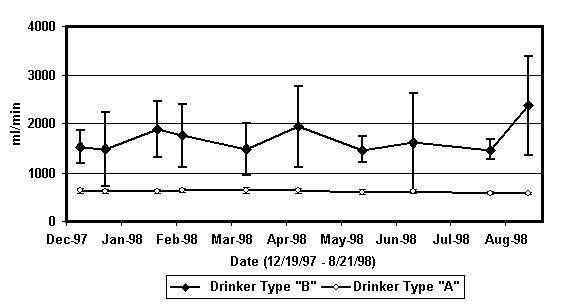
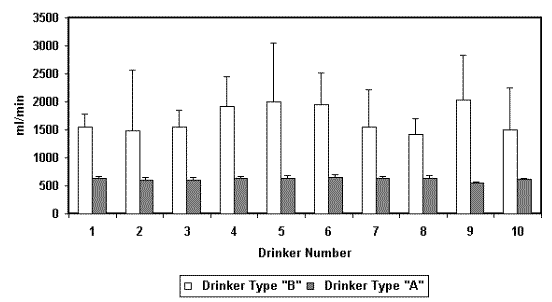
Figure 1. Flow rates (ml/min, mean + STD) of drinkers in a gestation facility. Flow rates were assessed for 10 Arato drinkers (Drinker Type A) and 10 nipple drinkers (Drinker Type B) at 3-4 week intervals for 8 months (December � August). The top figure shows the rates for each type over time. The second figure illustrates the flow rates for each drinker.
Midstream urine samples were collected from sows using the water delivery systems. The samples were analyzed using established techniques. Some of the urine parameters, such as pH, did not differ between systems or between sampling dates. In contrast, urine specific gravity (SG) did differ between systems (Figure 2). Based on our previous findings, urine SG should be less than 1.010 in sows consuming sufficient water. The urinalysis results indicated that the urine SG of sows using Arato and nipple drinkers was consistently less than 1.010. Based on urine SG, the supplemental provision of water by troughs (weeks 41-52) did not improve/increase water intake by sows using the drinkers.
The presence of white blood cells (WBC), bacteria and protein in urine is indicative of urine abnormalities and presumably cystitis and/or pyelonephritis. The frequency distributions of percent negative samples for these parameters are shown in Figure 2. Collectively, these results demonstrated that fewer urine abnormalities were evident in urine collected from sows using the Arato drinkers. However, it should be noted that the overall frequency of negative samples was lower than expected on this particular farm.
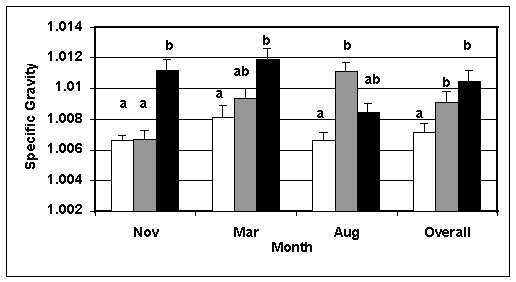
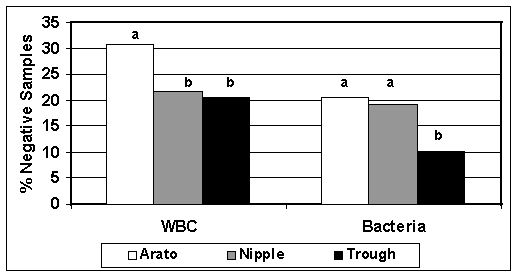
Figure 2. Urine specific gravity for sows using three types of water delivery systems (top figure). The bottom figure provides the percent of negative samples for white blood cells (WBC) and bacteria in urine collected from sows. ab Within month or dependent variable, columns with different superscripts differ (P<.05).
Farrowing: Five farrowing rooms were used in this phase of the study. In each room, one row of 12 crates were equipped with Arato drinkers and one row (12 crates) had the original nipple drinkers. Two water meters were installed to record water use in each room. Water meter readings were recording weekly. The original piglet drinkers were not removed and thus, water use by piglets was included in the weekly water use by the lactating sows. It was anticipated that water use by nursing piglets would be negligible and would not be affected by sow drinker type.
Weekly water use by a farrowing room is illustrated in Figure 3. A 3-4 week cycle of increasing water use, followed by a precipitous decease, was evident for each room over the 52-week study. This pattern of water use presumably is due to increasing water requirements of sows during lactation. The sudden decrease in water use reflects the movement of all sows from the farrowing house at the time of weaning. With few notable exceptions, weekly water use failed to return to baseline (i.e. no use for one week out of four). Total water for each room over the 52 weeks is given in Table 4.
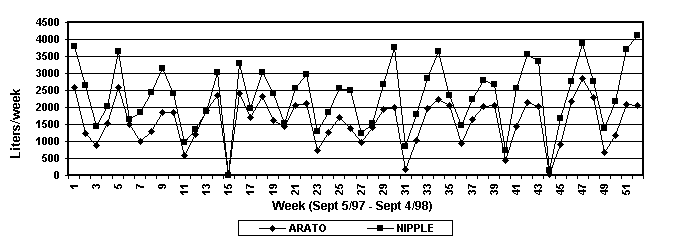
Figure 3. Weekly water use (liters) in a representative farrowing room. Within the room, 12 crates were fitted with Arato drinkers and 12 crates equipped with nipple drinkers. The water meters were placed near the entrance to the room. Water use was recorded for 52 weeks.
Table 4. Total water use (gallons) in farrowing facilities for the 52-week study. Each farrowing room had 24 crates. For each room, twelve crates (one side of the room) were equipped with Arato drinkers. Twelve crates were equipped with nipple drinkers. Water use was recording weekly.
|
|
| |
|
Farrowing Room |
ARATO |
NIPPLE |
|
FARROWING-2 |
27674.7 |
31534.5 |
|
FARROWING-4 |
21556.6 |
31820.8 |
|
FARROWING-6 |
24214.5 |
33450.8 |
|
FARROWING-8 |
26115.0 |
36281.3 |
|
FARROWING-10 |
19955.5 |
27870.0 |
|
Sum of All Rooms |
99604.2 |
138574.7 |
|
Average Use by Room |
23903.3 |
32191.5 |
It was suggested that the �conservative� water use by lactating sows using Arato drinkers may predispose the sows to problems with performance, specifically, fewer pigs weaned per sow and decreased feed intake. As shown in Figure 4, there were no differences in pigs weaned/sow. An accurate assessment of feed allowance could not be determined from the sow data cards. However, feed intake by a lactating sow has a major influence on the weaning-to-service interval (WSI). Using PigChamp records (database applications), the weaning-to-service intervals were obtained for approximately 600 sows (300 for each drinker type). The WSI�s were 5.76 + 4.3 days and 5.41 + 2.8 days for sows, which used nipple drinkers and Arato drinkers, respectively, during lactation (Figure 4). This failure to detect differences in WSI demonstrates that feed intake presumably was similar for sows using the different types of drinkers. A recent investigation (Leibbrandt et al., 2001) indicated that sow performance was affected by drinker flow rates during the summer (Table 5). Our results indicate that despite the lower flow rate of Arato drinkers, sow performance was not compromised. Based on previous reports, it is evident that 600-700 ml/min is the minimum flow rate for drinkers in farrowing crates.
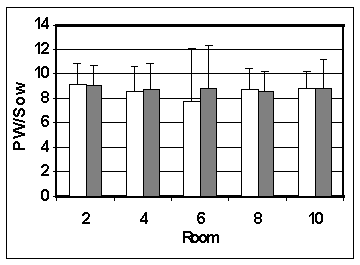
Figure 4. Basic assessment of sow performance during and after lactation. The top figure illustrates the number of pigs weaned per sow (mean+STD). The numbers in the X-axis represent farrowing room number. The open bars are results for sows using Arato drinkers during lactation. The dark bars are results for sows using nipple drinkers. Lactation length was 21 days. The figure on the right shows the weaning to service intervals (percent of weaned sows) for sows using Arato or nipple drinkers.
Table 5. Effects of drinker flow rate and season on sow and litter performance (Leibbrandt et al., 2001).
|
|
Winter |
Summer | ||
|
|
Water flow (ml/min) | |||
|
Parameter |
700 |
70 |
700 |
70 |
|
Litter wt (kg) � 14 d * |
40.1 |
40.1 |
37.4 |
37.6 |
|
Litter wt (kg) �21 d * |
53.7 |
52.7 |
49.3 |
50.0 |
|
Sow wt loss (kg/d): 0-21 d ** |
-0.25 |
-0.67 |
-0.66 |
-1.00 |
|
Feed intake (kg/d): 0-21 d ** |
5.12 |
4.24 |
4.05 |
3.65 |
|
* Significant effect (P<.05) of season. ** Significant effect (P<.01) of season and flow rate. | ||||
Nursery Rooms: Six nursery rooms with 24 pens/room and 20-22 pigs/pen were used in the investigation. Twelve pens in each room were equipped with two Arato drinkers. The other pens continued to use nipple drinkers, which were previously in use. Each room was equipped with two water meters to measure water use by the drinker systems. Weekly water by the 6 nursery rooms is illustrated in Figure 5. For each room, pigs used less water with access to the Arato drinkers than the nipple drinkers.
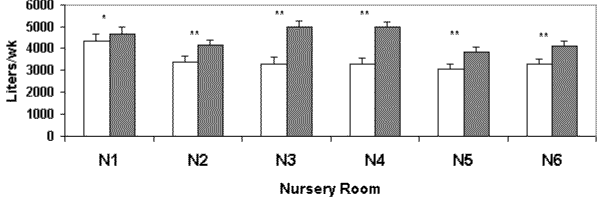
Figure 5. Weekly water use (liters; mean + SEM) by drinkers in six nursery rooms. The * and ** indicate that water use differed between Arato (open bars) and nipple drinkers (dark bars) at P<.05 and P<.01, respectively. Water use was recorded for 52 weeks
Total water use for the 52 weeks differed by 78,713 gallons between the two drinker types for the 6 rooms (Table 6). Thus, water use by Arato drinkers was 71.9% of the water use by nipple drinkers. On an individual pig basis (assuming 22 pigs/pen), a pig used between 1.86 liters/day (0.49 gallons/pig/day) and 2.41 liters/day (0.63 gallons/pig/day).
Table 6. Total water use (gallons) in the nursery rooms for the 52-week study. Each nursery room had twelve pens equipped with 2 Arato drinkers and 12 pens equipped with nipple drinkers. There were 20-22 pigs/pen. Water use was recorded weekly.
|
Nursery Room |
ARATO |
NIPPLE |
|
NURSERY-1 |
59096.6 |
63783.2 |
|
NURSERY-2 |
46252.1 |
56787.9 |
|
NURSERY-3 |
45153.2 |
67974.5 |
|
NURSERY-4 |
44956.1 |
68076.3 |
|
NURSERY-5 |
40994.7 |
52194.7 |
|
NURSERY-6 |
44737.4 |
56516.1 |
|
Sum of All Rooms |
201206.6 |
279918.9 |
|
Average Use |
46865.0 |
60309.9 |
Finishing: Total water use in four finishing barns is given in Table 7. Each barn had 36 pens with 22-25 pigs placed/pen. One side of each barn was equipped with Arato drinkers and the other side had nipple drinkers. Each pen had 2 drinkers. Water meters were installed to record water use for each side of each barn. Weekly water use was recorded for 52 weeks. For 3 of the 4 barns, weekly water use was less by pens with Arato than nipple drinkers. Weekly water use by the finishing barns is illustrated in Figure 6.
Table 7. Total water use by Arato and nipple systems in four commercial finishing barns. For each type of drinker, eighteen pens (22-25 pigs/pen) in each barn were equipped with 2 drinkers/pen. The values represent the total water use for the 52-week study period.
|
Building |
ARATO |
NIPPLE |
|
FINISHING-1 |
163351.3 |
212114.7 |
|
FINISHING-3 |
281236.1 |
239056.3 |
|
FINISHING-5 |
259553.4 |
276494.7 |
|
FINISHING-7 |
146515.3 |
197243.9 |
|
Sum of All Buildings |
850656.1 |
924909.7 |
|
Average Use |
212664.0 |
231227.4 |
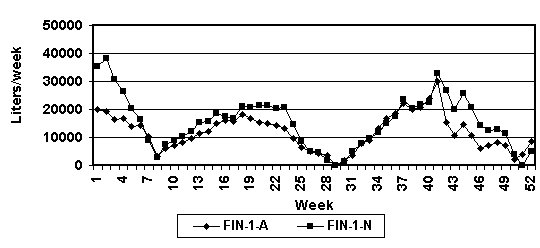
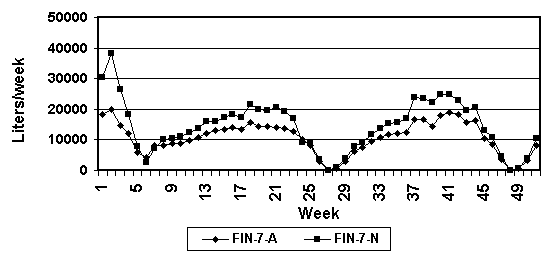
Figure 6. Weekly water use in two commercial finishing barns. (FIN-1-A = finishing barn 1, Arato drinkers: FIN-1-N = finishing barn 1, nipple drinkers).
On at least 5 production cycles (or turns of a barn), water use reached a plateau at approximately 8-9 weeks after pigs were placed in the barn (Figure 6). This observation is somewhat unexpected. It was anticipated that water use would gradually increase during the grow/finish phase until the initial sorting for slaughter. Evidently, the pigs reached an �upper limit� in water use for both types of drinkers. Our initial concern was whether the systems were restricting water intake when the pigs reach a certain size. However, in retrospect, these results are not surprising. Several European investigators developed regression equations to estimate the relationship between water intake, metabolic body weight and feeding level (see Mroz et al, 1995). Using any of these equations, water intake does level off during finishing.
According to Mroz et al. (1995), a 60 kg pig has a daily �water income� of 1.9-3.3 liters/day. In addition, many researchers recommend that growing-finishing pigs should consume a minimal water:feed ration (vol/wt) of 2:1. If these recommendations are valid, it is evident that the pigs in the present study were consuming sufficient water (2.2 � 4.4 liters/day) to meet their daily requirements.
One of the important considerations regarding water use in grow-finish facilities is effective administration of water medications. Figures 7 and 8 provide the relation between water use and antibiotic costs in finishing facilities. Water use varies between drinker types and thus, the cost of antibiotics (on a $/pig basis) also will vary.
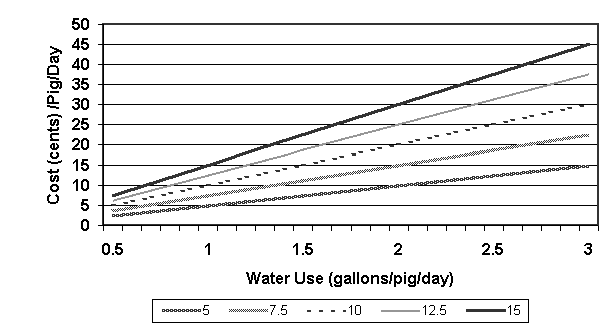
Figure 7. Relationship between water use and water medication costs. The X-axis provides daily water use and the Y-axis gives the cost/pig/day. Each line represents the cost (cents) of medication per gallon of water. Obviously, an increase in antibiotic cost and/or water use have dramatic effects on the cost of medicating pigs through the water.
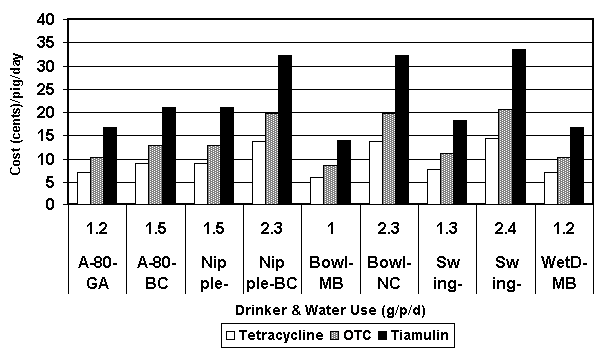
Figure 8. Differences in medication costs as related to water use by different water delivery devices. The numbers (1.2, 1.5 etc) on the X-axis refer to the water use/pig on a daily basis. The A-80 is the Arato drinker. Nipple, bowl and swing drinkers are self-explanatory. The last set of bars refers to a wet-dry system. The initials following the drinker name refer to the initials of the investigator. The costs of the tetracycline, oxytetracycline (OTC) and tiamulin were set at 6, 9 and 14 cents/gallon of medicated water, respectively.
Summary
The primary goal of this paper is to challenge producers to consider the value of water in commercial pig production. Most of the results were derived from one study on commercial farms and the information may not be applicable to all units or all conditions. Several other studies have been conducted and published; however, the vast majority of previous research was conducted under controlled conditions with small groups of pigs.
One factor, which was superficially reviewed, is the role of diet and feed intake on water consumption and requirements of pigs. The interaction between feed and water intake is important and should be discussed in greater detail in subsequent papers or presentations. As the NC pork industry modifies waste management programs to meet regulations, it is not surprising that water use and the generation of wastewater is a concern. Like all phases and aspects of production, effective management of existing equipment, careful consideration of new equipment acquisitions and attention to the pigs� needs are necessary for the long-term success of production.
References
Almond, G.W. and Stevens, J.B. 1995. Urinalysis techniques for swine practitioners. Comp. Cont.
Ed. Pract. Vet. 17:121-129.
Bollwahn, W. and Arnhofer, G. 1989. The importance of exogenous factors on the composition of
the urine of breeding sows. Tierarztl Prax 17:43-46.
D'Allaire, S., Drolet, R. and Chagnon, M. 1991. The causes of sow mortality: A retrospective study.
Can. Vet. J. 32:241-243.
Fraser D., Patience J.F., Phillips P.A. and McLeese, J.M. 1990. Water for piglets and lactating sows:
Quantity, quality and quandaries. In: Recent Advances in Animal Nutrition. Ed. Haresign W. and DJA Cole. Butterworths; Boston. pp. 137-160.
Gardner, J.A.A., Dunkin, A.C. and Lloyd, L.C. 1990. Pig Production in Australia.
Butterworths;London, pp 318-319.
Jones, J.E.T. 1992. Urinary System. In Diseases of Swine. 7th Edition. Ed. A.D. Leman, B.E. Straw,
et al. Iowa State University Press: Ames. pp. 217-222.
Jourquin, J., Seynaeve, M. and De Wilde, R.O. 1992. The influence of the spontaneous water intake
on the urine composition and urological parmeters in gestating and lactating gilts and sows. 12 th Int. Pig. Soc. Cong. pg 605.
Klopfenstein, C., D'Allaire, S. and Martineau, G-P. 1994. What sows have to say about water
intake. Proc. A.D. Leman Swine Conf. pp. 71-77.
Leibbrandt, F.D., Johnston, L.J., Shurson, G.C., et al. 2001. Effect of nipple drinker water flow rate
and season on performance of lactating swine. J. Anim. Sci. 79:2770-2775.
Madec, F. 1984. Urinary disorders in intensive pig herds. Pig News and Information. 5:89-93.
Madec, F. and David, F. 1983. Les troubles urinaires des troupeaux de truies: Diagnostic, incidence
et circonstances d'apparition. J. Rech Porcine F. 15:431-446.
Madec, F., Cariolet R. and Dantzer, R. 1986. Relevance of some behavioural criteria concerning the
sow in intensive pig farming and veterinary practice. Ann. Rech. Vet. 17:177-184.
Midwest Plan Service. 1983. Swine housing and equipment handbook. pg 3.
Mroz, Z., Jongbloed, A.W., Van Diepen, J.T.M. et al. 1995. Excretory and
physiologicaconsequences of reducing water supply to nonpregnant sows. J. Anim. Sci. (Suppl 1). 73:213.
Phillips, P.A., Fraser, D. and Thompson, B.K. 1990. The influence of water nipple flow rate and
position and room temperature on sow water intake and spillage. Appl. Eng. Agric. 6:75-78.
Smith, W.J. 1984. Sow mortality - limited survey. Proc. Int. Pig Vet. Soc. 8:368.
Straub, G., Weniger, J.H., Tawfik, E.S. and Steinhauf, G. 1976. The effect of high envrionmental
temperatures on fattening performance and growth of boars. Livestock Prod. Sci. 3:65-74.
Wendt, M. and Vesper, C. 1992. Occurrence of Eubacterium suis in breeding herds. 12th Proc. Int.
Pig. Vet. Cong., The Hague, p. 334.
Yang, T.S., Price, M.A. and Aherne, F.X. 1984. The effect of level of feeding on water turnover in
growing pigs. App. Anim. Behavior Sci. 12:103-109.
| Back Up |