Download this Document - MS Word
Project Report
The ultimate goal of this research is to develop an environmentally- and economically- sound technology to manage swine manure efficiently. The technology is the thermochemical conversion (TCC) process of swine manure. The objectives of this feasibility study include:
The key parameters affecting the TCC process include temperature, pressure, reductant reagent addition, manure solids content, retention time, and pH.
The experimental setup of the TCC process includes the key apparatus, thermochemical reactor or TCC processor, the temperature and pressure control system, and the TCC process integration unit. The reactor is made of T316 stainless steel with an extreme operation conditions of 34.5MPa (5000 psi) at 375 � C (705 � F). The reactor volume is 1.8 liters (0.5 gal) equipped with two 6-blade impellers and a serpentine cooling coil. A condensing-reflux unit is attached to the reactor for reflux purpose when needed. The temperature controller features three term PID control, high temperature/pressure limit indication/cutoff, and thermocouple burnout or malfunction protection control as well.
The feedstock, fresh swine manure, was collected from the floor of finisher rooms and stored under 4 � C (400 � F) for no more than a week. After determination of the solid content, the feedstock was prepared by adjusting the total solid content of the fresh manure to about 20%wt with water.
Gas product separation was readily done after the reactor was cooled to about room temperature, and the gas sample was taken. Oil product separation was also readily done after the run since it automatically separated with the post-processed water. Solid and post- processed water separation was achieved through filtration. The COD analysis was performed by the U.S. EPA approved HACH colorimeter method. Gas product analysis was done by a gas chromatography (GC) method that was designed for simple gas analysis, e.g., of CH4, CO2, H2, N2, and CO. The amount of gas product was estimated by the BWRS equation of state that was developed for pressure-volume-temperature (P-V-T) calculation under high pressure. Elemental analysis including carbon, hydrogen, nitrogen, sulfur, and heavy metal (representatively mercury and lead) was measured by the Microanalysis Laboratory, UIUC, using the carbon-hydrogen-nitrogen (CHN) analyzer. Solids measurements were followed conventional therma1 methods that are U.S. EPA accepted.
The TCC process of swine manure to produce oil and reduce waste was continuously investigated. Operating parameters that affect the process include temperature, retention time, pH value, and the ratio of carbon monoxide-to-volatile solids. In this study, the ranges of the operating parameters were: operating temperature from 275 to 350 � C, operating pressure from 7 to 18 MPa, CO-to-VS ratio from 0.07 to 0.25 (or CO initial pressure from 0.34 to 1.8 MPa), retention time 5 minutes to 180 minutes, pH value from 4 to 10, and total solids content from 10% to 25%. Carbon monoxide was employed as the reductive reagent and no extra catalyst was added.
The average yield of raw oil product for 90 runs was 53.8% with a standard deviation of 19.1%. The wide range of standard deviation is due to the variation of operation conditions. The highest rate of raw oil product yield was 79.9% and more than two thirds of the runs achieved a 50% or higher yield rate. The average carbon and hydrogen composition was 70.8%wt and 9.0%wt, with highest values of 77.9% and 9.83%, respectively. The nitrogen content was averaged at 4.1% with a standard deviation of 0.4%. About 3.3% of ash was present in the raw oil product. The oxygen content was calculated as the difference of the other mentioned elements and ash. Its average was 11.9%. Heating values were averaged to about 34,940 kJ/kg with a standard deviation of 1,590 kJ/kg. Moisture content of the raw oil product ranged from 10% to 14%. Eighty out of the 90 runs achieved a benzene solubility of raw oil product 70% or higher and the highest was 96.5%. The mean of the 80 runs was 79.5% as shown in Fig.2. A review of the literature shows the quality of TCC oil product is equivalent to those pyrolysis oils from wood sludge liquefaction.
The temperature is a key factor affecting the TCC process. Raw oil product would not be achieved until the temperature had reached 275 � C or above. Temperature higher than 335�C would lead to more solid char formation and thus is not recommended for the TCC process. The necessary retention time for the process to convert organic matter to oil is dependent upon the operating temperature. High temperature increases the rate of reaction and shortens the retention time. At 285 � C, the retention time of 120 minutes is necessary for the oil product yield to reach 60%, and the oil yield dropped significantly as the RT shortened. At 295 � C and 305 � C, it took less than 30 minutes to reach to 60% or even higher yield. This reduces the operating cost dramatically. After 60 minutes, the yields under 295 � C and 305 � C started to drop and they all reached about the some yield at about 60%. Meanwhile, increasing RT at temperature higher than 295 � C will not help increasing COD reduction rates because of the reductive atmosphere created by high reactive CO. The pH value of the feedstock affects the TCC process. However, it may not beneficial technically and economically to change the pH of swine manure. A high CO:VS ratio would achieve an increase of the raw oil product yield up to 10%, but it did not benefits the solubility of raw oil product and waste reduction rates. CO:VS ratios higher than 0.1 are not recommended for the TCC process. Solids content in feedstock significantly affects the process. It is concluded that the higher TS, the more efficient the process, limited only by the handling ability of feedstock.
Experimental results showed that N2 has a similar effect as CO that promotes the oil product formation. This is very promising that if CO is replaced by N2, the operating cost of the TCC process will greatly reduced. However, the principle behind it is unknown so far. Our is to explore the gas addition effects on the TCC process. Experiments and lab analysis will be done on this subject. Other inert gases of nitrogen and carbon dioxide, and hydrogen and compressed air will also be investigated through the same process.
| Oct. 1997: | A bench TCC processor was installed in the Bioenvironmental Research Laboratory (BERL) on South Farm. |
| May 1998: | Feasibility experimental tests of the TCC processor by. The system was tested and preliminary parameters were determined. |
| May 1998: | Feedstock and effluent product analysis procedure were established. |
| May 22, '98: | The TCC bench reactor unit was completely destroyed in a lightning strike. |
| Nov. 1998: | New TCC system was reconstructed and in and the research was resumed with the help of a university emergency fund. |
| Dec. 1998: | Feasibility study was completed and draft report was composed. |
| July 1999 : | TCC oil product was successfully achieved. The oil yield was 60%wt or higher based on input volatile solids and the chemical analysis showed the carbon and hydrogen content were about 70%wt and 10%, respectively. |
| Dec. 1999: | The effects of operating parameters, including temperature, pressure retention time, solids content of the feedstock, pH and CO addition, on the TCC process were investigated. The highest oil yield was 79.9% based on the volatile solids input and the COD reduction rate reached 75%. |
Facts:
Pork industry is one of the most value-added agriculture sectors in the United States. As pork industry provides more and more food needs to our societies, there is a considerable amount of swine waste produced. It includes not only the wastewater and sludge, but the odor emission as well. The large confinement swine farms have become intensive point sources of air and water pollution. The impact of swine farming on the environment has been caused increasing concerns from scientific communities, government agencies, general public, and the pork industry itself. Tons of money has been spent yearly on swine waste storage, transport, treatment, land application, and the downstream wastewater treatment. Furthermore, odor emission from swine farm has caused more and more outcries from the public than ever. It has become another hot topic of environment issue (Stith and Warrick, 1996). Swine manure, once considered as a valuable natural fertilizer, now becomes an expensive burden on the pork industry.
On the other hand, livestock waste could be a plentiful source of renewable energy. It has the potential to be converted to renewable energy through biological and chemical processes. The tremendous amount of swine manure produced each year can be an alternative renewable energy source while our fossil energy reserves are depleting. It can be converted to fuel through novel technologies such as thermochemical conversion processes.
Thermochemical conversion (TCC) is a chemical reforming process of organic matters in a heated enclosure, usually in an oxygen-absent or very low oxygen level environment. TCC processes had been studied using primarily coal, peat, and lignocellulosic materials such as wood sludge as feedstock during the 1970's. It was technically sound. However, it was not been developed into commercial processes for energy production purpose, mainly because of its economical inefficiency, until recently when a few pilot and/or pre- commercial TCC processes are in operation (Farris and Weeks, 1996; Trenka, 1996; Duff and Dickow, 1994; Smith et al., 1993).
Thus, TCC technology has the potential of being applied to the treatment of swine manure, a cost-negative supply of feedstock for renewable energy production. The treatment of swine manure through TCC process can greatly reduce wastewater intensity and odor emission. Meanwhile, TCC process produces energy, which can be used as energy for the TCC process itself, making the process potentially energy self-sustained.
Swine manure management includes the collection, transport, storage, handling, treatment, disposal, and utilization. The most widely used method of swine manure treatment is biological, including lagoon process, anaerobic digestion, and composting. Most swine waste lagoons are aerobic. Naturally aerated lagoons require extremely large surface areas to treat often highly diluted liquid wastes. Mechanically aerated lagoons are becoming increasingly popular because less odor emission involves. Anaerobic digesters are also used in swine waste treatment. The process is relatively costly but usually associates with the biogas production. Composting is another process for solids-waste manure treatment. It renders the organic waste biologically stable after a period of time under high temperature with sufficient oxygen and moisture contents. The compost product is suitable for land disposal. However, it emits nuisance odor from its operation and is not very suitable for swine waste treatment.
Chemical treatment methods including chlorination, flocculation, hydrolysis, osmosis, and pyrolysis are also available. However, none of these has been put into commercial practice so far mainly due to different reasons.
Odor emission is another pollution from swine farms. Nuisance odor from animal waste is largely due to the release of volatile organic compounds from the fermentative degradation of fecal residues. Aeration is a good method to eliminate odors resulting in much lower residual concentration of odorants even after very short period of aeration time. However, this is not a feasible practice for raw manure treatment.
Historically, manure had been spread onto cropland for its fertilizer and soil amendment value. Currently, however, livestock manure management is far more from just land spreading because of the intense confinement operations. The increasing concerns on the pollution from swine farm have put the industry on a stringent situation. Pollution emanating from pig production system is mainly of concern in terms of water supplies and air pollution. Runoff from the operations is a source of high concentrations of bacteria, suspended and dissolved solids, and chemical and biological oxygen demands. High nitrogen concentrations leaking into ground and surface waters contribute to the aging of streams, nitrate poisoning of infants as well as livestock, and transmissions of infectious disease organisms to people, livestock, and wildlife. Environmental concerns and public reactions over the intensive livestock production facilities have led the legislature to pass new regulations on manure management. The regulations will likely become more stringent and make livestock farming more cost intensive. Traditional treatment processes are highly challenged because of the efficient and environmental concerns. A new technically and environmentally sound technology is highly desirable, not only for the sustainability of the livestock industry, but also for the environment protection.
Organic matters can be converted to various forms of energy by numbers of technical processes, depending upon the raw material characteristics and the type of energy desired. Biomass encompasses a wide variety of biological materials with distinctive physical and chemical characteristics, such as woody or ligno-cellulosic materials, various types of herbage, especially grasses and legumes, and crop residues. As a result, a wide variety of conversion schemes have been developed to best take advantage of the properties of the biomass to be processed. Biomass conversion technologies are well summarized by Robert Brown (1994).
The utilization of biomass as energy source is generally categorized into six main topical areas, as shown in Figure 2.1. The technology of thermochemical conversion is one of them, which includes three sub-categories: pyrolysis, gasification, and direct liquefaction.
Defined in its broadest sense, pyrolysis is the thermal decomposition of organic matter occurring in the absence of air or oxygen. Thermal decomposition in an oxygen deficient environment (that is, less oxygen is present than required stoichiometrically for complete combustion) can also be considered to be true pyrolysis as long as the primary products of the reaction are solids or liquid.
Pyrolysis can be further divided into two categories, conventional pyrolysis and flash pyrolysis. Conventional pyrolysis is characterized by a slow feedstock heating rate (less than 10 � C/s), relative low temperatures (less than 500 � C) and long gas and solids residence times (Brown, 1994). The primary products are tar and char as the secondary choking and polymerization reactions. Flash pyrolysis describes the rapid, moderate temperature (400 � C~600 � C) pyrolysis that produces quantities of liquids. Flash pyrolysis heats the biomass at rates of 100~10,000 � C/sec and vapor residence times are normally less than 2 seconds. The products are maximized at the expense of char and gas. The feedstock is usually dry matter.
Figure 2.1 Classification of biomass conversion technologies
Gasification describes the process in which oxygen-deficient thermal decomposition of organic matter yields non-condensable fuel or synthesis gases as the main reaction products. Gasification generally involves pyrolysis as well as combustion to provide heat for the endothermic pyrolysis reactions. However, indirectly heated gasification is often used to describe the process in which heat is brought from outside the reaction chamber to drive pyrolysis in the absence of combustion.
Liquefaction was historically linked to hydrogenation and other high-pressure thermal decomposition processes that employed reactive hydrogen or carbon monoxide carrier gases to produce a liquid fuel from organic matter at moderate temperatures (300 � C~400 � C). Liquefaction was initially developed for coal liquefaction. Recently, liquefaction has been used to describe any thermochemical conversion process that primarily yields a liquid tar/oil product. In liquefaction process, the carbonaceous materials are converted to liquefied products through a complex sequence of physical structure and chemical changes which involves (Chornet, 1985):
The main purpose of liquefaction is to increase the H/C ratio of the product oil relative to that present in the feedstock. A decrease of the O/C ration is also necessary to achieve hydrocarbon-like products. Addition of reducing gas, H2 or CO, is thus needed to increase the H/C ratio. In biomass materials oxygen removal occurs via internal dehydration and decarboxylation reactions occurring during the initial pyrolytic stages. Another necessity of successful liquefaction is most possible uniform feedstock slurry in a liquid carrier, i.e., specific solvent or simply an aqueous system.
The proposed feasibility study is filling into this liquefaction category that process swine manure slurry with reductant reagent, i.e., carbon monoxide, addition.
So far, nearly all of the available literatures on the studies of the thermochemical conversion of livestock manure were carried out during the 1970's. And almost all of these studies were concentrated on the pyrolysis or gasification of cattle manure to produce combustible gases. Kreis (1979) had summarized these studies in the decade with tables and illustrations from more than 65 references. Studies of cost analysis of the pyrolysis and other thermal processes were also made to explore the economical feasibility of practical operations of these processes.
White and Taiganides' work (1971) was possibly the first who published research on livestock manure pyrolysis. The main purpose of White and Taiganides' research was to obtain combustible gases from animal wastes through pyrolysis process. The feedstock was the animal waste of swine, beef, dairy, as well as poultry. The manure was dried and then grounded through a 40-mesh screen in most of the experiments. The samples were then heated from room temperature and pressure to 800?C at a controlled rate. The gaseous products were collected and the heating values were determined. Based on the conditions, dairy waste produced the most gas followed by chicken, beef, and swine. The combustible portion of the gases was between 50 ~ 60%. The calculated heating values for the gas product from swine waste was 3,256 kJ/kg (1,400 Btu/bI). The interesting founding is that the heating value of gas from newspaper appeared to be lower than that from animal wastes, only 1,410 kJ/kg (607 Btu/bI) based on total solids basis. The gas from swine waste had the lowest heating value of the wastes tested. When coupled with its high moisture content it would not produce enough heat to vaporize the moisture (1,025 kJ or 972 Btu is needed to vaporize one pound of water at 100�C). This was a feasibility study and no systematically experiments, such as the effects of temperature and pressure were performed.
Appell and colleagues (1980) focused on converting organic wastes to oil in batch and continuous mode. The results show that bovine (dairy) manure was not readily to be converted to oil at 250�C or lower, but with the treatment of CO and steam at 380�C and 40 MPa (6,000 psi) resulted in high conversions of dairy manure to oil. The conversion rate was 99% and the oil yield was 47%. Reactions were carried out in the presence of catalyst, sodium carbonate. Carbon monoxide and water were added as reductants. They found that the presence of CO heavily affected the oil yield as well as the organic matter conversion rate. Another important finding in Appell's research is the function of water in the thermal conversion process as a solvent and a reactant. This is even more important in the conversion of livestock manure slurry where a large quantity of water exists and dewatering is infeasible costly. Taking advantage of water content in raw manure will greatly value the conversion process, not only producing energy but also lightening the wastewater intense from livestock farm.
In Duun and associates' work (1976), a semi-continuous pyrolysis machine was used to process the cattle manure. The feed was dried out before the pyrolysis began. Low operation temperatures were adapted and varied from 200 to 400 � C under ambient pressure. Even a weak negative pressure was applied to draw the produced gas products out of the reaction chamber. This is unique and quite different from the others' work. The yield of solids product (char) was 25.0 ~ 53.5%, and that of liquid was 11.4 ~ 32.1%. More char formed because of the low pyrolysis temperature. The dry-up of feedstock is the major drawback of the process that is costly and environment-negative.
Garner and Smith (1973) conducted similar studies on pyrolysis of cattle waste. The purposes was to explore if pyrolysis of cattle feedlot waste was a possible solution to the pollution of livestock waste and livestock manure could be used as an energy source or even a basic material source for chemical industry. They found that the maximum oil yields were obtained with the pyrolysis temperature of 400 ~ 500 � C and low pressures. The pyrolysis produced a combustible gas with a fuel content of 695 ~ 930 kJ/kg (300 ~ 400 Btu/ft3) that contained H2, CH4, CO, CO2, and N2 with traces of C2H6 and C2H4. About 20~30% of the fuel value was recovered from the dry raw manure.
Though there were some research that converted organic waste into oil (e.g., Appell et al., 1980), most of them are the conversion of manure, through pyrolysis process, to gaseous products. Conversion of swine manure was rarely the topic in these studies.
The effective management and utilization of swine manure are of importance in multi- aspects: livestock waste management, environment protection, and alternative renewable energy production.
Currently, land spreading of livestock manure is not considered as a good practice in terms of environment protection. The most positive management and utilization of swine manure is the anaerobic digestion � the biochemical treatment processes. Not only the organic content of wastes is typically reduced by about 50% through anaerobic digestion (U.S. Congress, 1980a), but quite large amount of renewable energy (mainly methane) is produced. However, the retention time is so long that a tremendous amount of space is needed for the digester and its auxiliary facilities. Thus, such biochemical process is not feasible for large confinement swine farms.
Through thermochemical conversion technology, the conversion rate of organic matter in the raw manure can be as high as 90% or more (Appell et al., 1980; White and Taiganides, 1971). The solids and the wastewater are separated and COD in the wastewater is greatly reduced. The successful TCC processor shall be an on-site unit that directly processes fresh manure from the barn. Thus, much less storage is required. TCC processor will be compact and much less space occupying than those of biological treatment processes such as lagoons and digesters do. Another benefit of such a short period of manure storage time is the odor reduction � less storage time means less odor emission. As a successful TCC unit for a large confinement hog farm, the energy needed for running the processor is most likely self-sustainable, i.e., the liquid fuel produced from the TCC processor could be used as the energy input for the processor needs. With the major portion of the organic solids removed from the swine manure, the post-processes waste is most possibly suitable for municipal treatment with a simple pre-treatment. The solid residues are greatly minimized and convenient for disposal.
The TCC process of swine manure converts most of the organic matters to oil and gases that are readily separated from the post-processed water. The negative environment impact of swine manure due to its solids, liquid and gaseous wastes are significantly lessened. Wastewater is reduced dramatically in nutrient concentration. The COD of post-processed water could drop 70% or less of its original manure slurry. Possible underground water pollution from lagoon leaking is eliminated because no lagoon is necessary with the application of the TCC technology.
Swine manure thermochemical conversion can reduce the odor emission from swine farm for three reasons. First, the thermochemical conversion process is carried out in an enclosed system. There is no outlet for odor emission. Secondly, the storage time of swine manure is largely reduced and leaves no time for nuisance odorants developing. Thirdly, the thermochemical conversion process is under high oxidative atmosphere of temperature and pressure. The odor compounds (such as ammonia and phenols) are oxidized to a higher oxidative status that are odorless. Some high molecule-weight compounds are broken down to smaller molecules that have no or much less odor nuisance. Microorganisms that are potentially disease-transmitting are killed in such a harsh condition.
Swine manure thermochemical conversion can also benefits the environment by reducing carbon dioxide emission to atmosphere. Our climate change is considered one of the most serious environmental threats throughout the world because of its potential negative impact on food production processes. Fossil fuel combustion, especially those based on coal burning, is the major contributor to the increasing of CO2 in the atmosphere, thereby contributing the global warming. Therefore, concerns about the CO2 emission may discourage widespread dependence on fossil fuel and encourage the development and utilization of renewable energy technologies including energy from biomass. The key point here is that the use of biosources adds no net CO2 to our environment: carbon dioxide participates in life cycle in biosphere (Bull, 1991). As the fossil fuels are increasingly replaced by biofuels, the addition of CO2 to the atmosphere will be slowed down dramatically. Therefore, the utilization of liquid fuel from swine manure will add no extra CO2 to our atmosphere, thus protect our globe from warming up in a long run.
Through the thermochemical conversion technology, swine manure, one of the most abundant biomass resources, can be converted to useful products, liquid fuel � a renewable energy.
Among renewable energy resources, biomass is one of the most promising. It has the potential of providing renewable energy through combustion, thermochemical conversion, and biochemical processes. The amount of energy supplied by biomass, now relatively small, could expand rapidly when the nation's energy problems will be particularly acute. Domestic fossil fuel reserves are being rapidly depleted; U.S. residents will be forced to turn to renewable energy for some of their energy needs within a decade or two (Primentel and Rodrigues, 1994). According to U.S. Department of Energy, U.S. now imports about one half of its oil and will import two-thirds of its total consumption in the year 2015. While the oil consumption increases at an annual rate of +1.8% (excluding petroleum products which increase at +4.9% and natural gas which increases at +2.3%), the oil production rate will continuously decrease at an annual rate of -1.1% until the year 2015 (US DOE, 1996). This trend encourages the studies on renewable energy sources and thermochemical conversion of swine manure is one of them.
As the technology advances, bioenergy from swine manure and other biomass resources can produce renewable energy that could compete with conventional fossil fuels and help the United States reduce its dependence on imported oil.
The ultimate goal of this research is to develop an environmentally- and economically-sound technology to manage swine manure efficiently using the thermochemical conversion process (TCC) in swine farm practice. The objectives of this feasibility study include:
In this chapter, experiment setup, experimental design, analytical assays, and experimental operation procedures for the feasibility study are described. Experiment Setup includes the description of the key apparatus, experiment process and control system. Choosing and applying process parameters are discussed in the section of Experimental Design. Analytical methods of the raw feedstock and products are presented in the section of Analytical Assays. The detailed description of process operation is given in the section of Experiment Procedures.
The experimental setup of the TCC process includs the key apparatus, thermochemical reactor or TCC processor, the temperature and pressure control system, and the TCC process integration unit.
The basic requirements for a TCC processor that can perform the task in this study includes being able to work under high temperatues and pressures, easy to conrtol for resaerch purposes, and safe. Based upon these criteria, a floor-stand stirred-tank pressure reactor, Model 4572, was chosen from Parr Instruments Company (Moline, Illinois). The reactor is made of T316 stainless steel with an extreme operation conditions of 34.5 MPa (5000 psi) at 375 � C (705 � F). The reactor has a volume of 1.8 liters (a half gallon) equiped with two 6-blade impellers and a serpentine cooling coil. The agitation propellers are driven by a quarter-horse power motor through a magnetic drive with 16 in-lb torque. A rupture disc and a pressure relief valve are also equiped with the reactor to ensure safety. A condensing-reflux unit is attached to the reactor for reflux purpose when needed. A sketch of the reactor and a picture of its components are shown in Figure 3-1 and 3-2.
Temperature is most important in the thermochemical conversion process. It affects thermal depolymerization reactions directly. Therefore, temperature was employed as the key control parameter. In the first stage study, pressure control was indirectly achieved through temperature control because the water vapor-liquid system was in equilibrium when the operation reaches its steady state. In other words, the pressure was coupled with temperature in such a system A temperature controller of Model 4842 from Parr Instruments Company (Molline, IL) was chosen. The controller features three term PID control, high tempaerture limit indication/cutoff, high pressure limit indication/cutoff, and thermocouple burnout or malfunction protection control as well. The resolutions are 1 � C and 69 kPa (10 psi), and accuracies � 2 � C and � 1.5% of working pressure range, respectively. Two type J thermocouples (iron-constantan) are adapted as temperature sensor, placing in the thermowell of the reactor. One serves as control signal detector, the other as high temperature cutoff control detector. The controller supplies a full power of 1500 watts to the heater for temperature rise-up and one-half of its full power for temperature control operation. The cooling water to the cooling coil is controlled by a solenoid valve triggered by over-limit signal from the controller. The agitation speed of the impellers is controlled through the controller and were continuously monitored by a digital tachometer.
Figure 3.1 Sketch of the TCC reactor
The reactor unit and control system were mounted on a floor-stand cart. Picture of the floor-stand reactor unit is shown in Figure 3-3. A process flow chart of the batch mode TCC process is shown in Figure 3-4.
Experimental design here refers to all the considerations to fulfil the objectives of this reaserch, including parameters affecting the process, variables to be investigated, methedology of the parameter examination, and statistically effective experimental design. However, there were only some of the key parameters considered during the feasibility study. There are four parameters considered in the first stage study: temperature, CO initial pressure (CO initial ratio to total volatile solids), solids content, retention time, and pH of the feedstock.
Figure 3.2 Picture of the TCC processor components. The main parts are (a) cylinder; (b) split-ring closure; (c) pressure gauge; (d) pressure transducer; (e) cooling coil; (f) propellers; (g) pressure relieve valve and rupture disc; (h) magnetic drive; (i) condenser; (j) condensate collector.
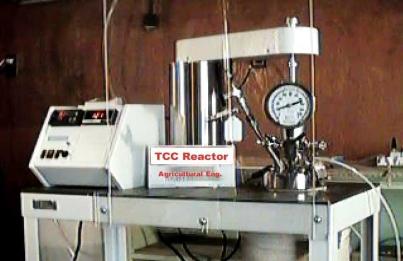
Figure 3.3 Picture of the floor-stand reactor unit
Temperature is the most important parameter in the TCC process. In the experimental design for feasibility study, temperature was assigned as the presenting parameter. Since equilibrium is established between water vapor and liquid water in the close system, and water vapor condensation compensates the pressure increase contributed by the gases produced during the course of reaction. Therefore, the temperature and total operating pressure of the close system are coupled.
Carbon monoxide (CO) serves as reductive reactant in the system. The amount of CO added will affect the oxygen content in the depolymerized products, or the quality of the oil product. In the closed system, the initial pressure of CO presents the initial amount of CO added. If fixing the amount of feedstock, the same CO initial pressure also means the same ratio of CO to total volatile solids.
Solids content is another major parameter affecting the TCC process. Based on preliminary tests, about 85-88% of the total solids is volatile. The volatile solids content is the most possible potential of the manure to be converted to oil products. More volatile solids content is desirable for the purpose of oil production. However, manure with 25%wt or more solids content is hard to pump and not suitable to the TCC process. Practically, the solids content from under slat manure pit usually is about 12% or even less. To start with, the level of solids content was assigned to 20% for the feasibility study and total solids (TS) was chosen as the presenting parameter.
Retention time is a kinetic parameter of the TCC process. It affects the organic conversion rate or product yields. Inefficient retention time of the reactants will lead to incompleteness of the conversion process. However, too long retention time will result in over-oxidization of the products and formation of char. The levels of retention time were set to 120 minutes for the feasibility study.
Figure 3.4 Flow chart of the batch mode TCC process for the feasibility study.
The pH value is the indication of the strength of acidity/alkalinity, or the concentration of hydrogen ion (H+) in the feedstock. The concentration of hydrogen ion affects the TCC process by serving as catalyst for the hydrolysis of cellulose and other carbohydrates and polymers. The statistical data of pH values for raw swine manure is about neutral, 7.5 � 0.57 (ASAE, 1997). Preliminary test of the fresh manure used in the study indicates that the pH is 6.5 � 0.5, lower than that mentioned above. Deviation of pH from neutral, either too high or too low, will affect the chemical process of the system, and will create severe chemical erosion on the apparatus under high temperatures as well. To focus on other parameters, the natural pH (pH = 6.5) of the fresh manure was accepted and monitored but not controlled.
Experiment procedures include the feedstock preparition, reactor operation, and product examination.
The feedstock, fresh swine manure, was collected from the floor of finisher rooms in the Swine Research Farm, College of Agricultural, Consumer and Environmental Sciences (ACES), University of Illinois at Urbana-Champaign. The fresh manure was stored in a 5- gallon bucket under 4 � C (40 � F) for no more than a week.
The total solids (TS) and the total volatile solids (VS) were the main interest. The contents of VS and TS were measured before the experiment runs. After the determination of the solids content, the feedstock was prepared by adjusting the total solids content of the fresh manure to about 20%wt with water. The prepared feedstock was then weighed, its pH value was measured and recorded before charging to the reactor.
One most important thing to mention is the loading of the reactor. It must never be filled to more than three-fourth of its available free space, and in most of the cases the charge must be reduced further for safe operation. Dangerous and destructive pressure can develop suddenly when water slurry is heated if there is no sufficient free space to accommodate the expending water which may increase to as much as three times its initial volume when heated to critical at 374 � C (705 � F). Recommanded by the manufacturer (Parr Instrument, 1998), the maximum allowable water loading (MAWL) volume can be esitmated by the following formula:
where the volume multiplier at maximum operation temperature can be read from the table given, and the loading rates for the reactor are suggested below. In the feasibility strudy, the loading rate was 40%~45% .
Table 3.1 Reactor loading rates vs. operation temperatures (Parr Instrument Company, 1998)
| Temperature | ~ 280�C | 280 ~ 360�C | 360 ~ 374�C |
| Loading rate | 2/3 | 1/2 | 1/3 |
After enclosing the reactor head and attached all the auxiliary parts, the reactor was heated up through the control of the controller according to a pre-set temperature level. The temperature heat-up rates are 5~10�C/min, as illustrated in Figure 3-5. It took 40-50 minutes for the temperature to reach its pre-set point. The highest temperature increasing rate occurred at about 220�C to 250�C when exothermic reactions started. The fluctuations were within about 5�C for temperature and 345 kPa (50 psi) for pressure, crespondingly.
Figure 3.5 Typical heating rate of TCC process
After each run, the operation temperature was cooled down to about 150�C or lower in 5 minutes at which the reactions was terminated, and to 70�C in 10 minutes. To remove all heat stored due to heat capacity, the reactor unit was further cooled for another hour to about the embient temperature. The temperature and residual pressure were recorded for gas product calculation purpose.
The agitation was believed having minor effect on the TCC process. Therefore, it was set at a constant speed of 200 rpm for all experiments in the feasibility study.
There are gaseous, liquid, and solid products after the TCC process. The gaseous product is the gases produced during the process, which contributes to the pressure increase after the reaction ceased, and unreacted carbon monoxide. The solids after the reaction are the inert foreign materials such as dirt as well as a small amount of char. Liquid products incluse the post-processed water with most of soluable minerals and the oil product.
Gas product separation was reaily done after the reactor was cooled to about room temperation. The gases were released slowly through a 100-ml serum bottle (as gas product sampler) equiped with three syringe needles. One was the inlet and the other two as outlets.
Oil product separation was also reaily done after the run since it is lighter than aqueous solution and floats at the top of the post-processed water. Oil product was sticky too. It was carefully collected and stored in a 100-ml wide-mouth sample bottle.
Solids and post-processed water separation was achieved through filtration. The solids and post-processed water were collected in a 1000-ml wide mouth bottle. Some of the char particles formed duing the process were so fine that they suspends in the liquid. Vaccum filteration was used to remove the suspended fine char particles from the liquid phase with a glass fiber filter (HACH company, Loveland, Co.) as well as the inert solids that was mainly the dirt.
The analyses performed as far include:
Gas composition analysis was performed by a gas chromatography, Model 580 by GOW-MAG Instrument Company (Bridgewater, NJ) designed for simple gas analysis such as CH4, CO2, C2H6, H2O, H2, N2, and CO. The GC is equipped with a column of porous polymer and molecular sieve 5A in the size of 80~100 meshes. The column is stainless steel, 1/8 inches in diameter (O.D.) that is 4 feet long. A HP 3393A Computing Integrator (Hewlett Packard Co., Avondale, PA) is attached to the GC for result computation and printing out. Serum bottles, 100 ml with rubber stoppers, were used as container for gas samples.
A 100-ml serum bottle with three syringe needles was used for TCC gas product sampling. The pressure gas product after TCC run was carefully adjusted to allow a reasonable flow rate through Tygon tubing and one of the needles into the sample bottle. The other two syringe needles on the rubble stopper served as outlets for the replaced gas. The gas sampling procedure took fifteen minutes or more to sure the gas inside the bottle is the TCC gas product and original gas in the bottle before sampling is completely replaced. The syringes were removed and the gas sample was ready for laboratory analysis. Known composition gas sample was prepared from pure gases (>99%) of N2, O2, CO, CO2, and CH4. The correction factors were obtained from the known composition gas sample. An example of the GC spectrum of a gas sample is presented in Figure 3-6 with gases retention time shown.
Gaseous product calculation was made by using Starling modified Benedict-Webb- Rubin (BWR) gas equation of state (Starling, 1971), or BWRS equation of state. This equation was first published in early 1970's and mainly used for the thermal property calculations of hydrocarbons. It can be employed in the conditions of temperature as low as 0.3 times of critical temperature and density as high as 2~3 times of critical density. The error range is 0.5%~2.0% for light hydrocarbons, CO2, H2S, and N2. Since the gases in final gaseous product of the TCC process are mainly carbon dioxide (CO2), nitrogen (N2), and unreacted carbon monoxide (CO), the equation of state was very well applicable.
Figure 3.6 An example of the GC spectrum of a gas sample
The equation of state has a form of pressure as the function of gas density and temperature:
(4-1)
where T is absolute temperature, P the absolute pressure, R universal gas constant; ρ gas density, Ao, Bo, Co, Do, Eo, a, b, c, d, α, and γ are all intermediate parameters which can be obtained through each individual component's critical properties and rules for mixture. The detailed application procedures are described in Appendix E.
To test the applicability of the BWRS equation of state, it was first used to predict the carbon dioxide density to compare to the known experimental values at 320K for a pressure range of 0.1 to 10 MPa (14.7 to 1470 psi) (Tianjin University, 1984). A spreadsheet of Excel was used as the tool and trial-and-error method on gas density was applied. The termination condition is that the error between the calculated pressure and the experimental pressure was 0.01% or less. The results show when pressures are 4 MPa (600 psi) or less the equation gives a very good prediction with an error less than � 1%. When pressure is up to 10 MPa (1470 psi) the error increases to 18% that is not tolerable for this feasibility study. For safe, the equation of state was used only under pressure less than 4 MPa (600 psi). On the other hand, the state of gas product after a TCC run has a relative low pressure, mostly less then 4 MPa.
Table 3.2 The examination of BWRS equation of state applied CO2
| P (MPa) | Vm, expt'l (L/mol) | ρm, expt'l (mol/L) | ρm, cal'd (mol/L) | Vm expt'l vs Vm cal. |
| 0.1 | 26.2 | 0.038 | 0.03794 | -0.1626% |
| 1.0 | 2.52 | 0.397 | 0.03964 | -0.1524% |
| 4.0 | 0.54 | 1.852 | 1.8258 | -1.4115% |
| 10.1 | 0.098 | 10.204 | 12.0616 | 18.2050% |
The solids measurements and procedures are mainly adopted from Standard Methods for the Examinations of Water and Wastewater published jointly by American Public Health Association, American Water Works Association, and Water Pollution Control Federation (1989).
The total solids content of a weighed sample was first dried in 105�C oven for over night. The sample in container (crucible or aluminum dish) was then transferred to a decicator to cool down to ambient temperature. The ratio of dry matter left in the container to its original wet weight is the percentage of the TS content.
Volatile solids (VS) was determined by burning the sample from TS measurement mentioned above in a muffle furnace at 550 � 50�C for two hours. Take the crucible out and let most of the heat dissipate in the air. Transfer the crucible into desiccator and cool down to room temperature. Weigh the crucible plus dried sample with balance, record the data. The difference of the total weight and the container (crucible or aluminum dish) is the amount of the fixed solids (FS). Volatile solids (VS) is obtained by substracting the FS from TS.
The other solids contents, such as suspended solids (SS), fixed suspended solids (FSS), dissolved solids (DS), volatile suspended Solids (VSS), fixed dissolved solids (FDS), volatile dissolved solids (VDS), were not important in this feasibility study, thus not measured. However, the measurement and calculation procedures are described in Appendix D for any future possible needs.
The elemental analyses include carbon, hydrogen and nitrogen (CHN) analysis, metallic element analysis, and sulfur analysis. In this feasibility study, metallic element analysis included potassium (K), phosphate (P), lead (Pb), and mercury (Hg). These analyses were carired out by Microanalysis Laboratory, School of Chemical Sciences, University of Illinois at Urbana-Champaign. The analyses were performed by carbon- hydrogen-nitrogen analyzer (CHN) and Inductively Coupled Plasma (ICP), respectively. Brief descriptions of the machines and analyses procedures are excerpted from the brochure A Guide To Microanalysis Services by Microanalysis Laboratory and their web page http://www.scs.uiuc.edu/~micro/ without permission (Microanalysis Laboratory, 1998).
CHN is an abbreviation for Carbon, Hydrogen, Nitrogen analyzer Model CHN CE440 by Exeter Analytical, Inc. (N. Chelmsford, MA, USA). This instrument detects these and only these three elements. To detect these elements the sample needs to be broken down into its atomic components and then separated. To break the sample down it is combusted in an oxygen atmosphere at 980�C. At this temperature all of the elements to be detected react with oxygen to form CO2, H2O, and NxOy. These gases are carried via a stream of helium gas to a detector. The detector reports a value to the computer that compares it to the known value of a standard. These values are calculated based on the weight of sample. Results are reported in % element by weight.
ICP is an abbreviation for Inductively Coupled Plasma Model Plasma II by Perkin Elmer (Norwalk, CT, USA). It is designed for metallic element analysis. The basic operating principle is based on intensity of emission from elements in an excited state. Digested samples are aspirated into the plasma where a portion of the sample is excited. (The typical temperature of the plasma is 8,000-10, 000 K.) The excited elements emit light (UV/VIS) at characteristic wavelengths. The computer compares the intensity of a sample to the intensity of a known standard. The actual analysis requires only a few minutes. Sample preparation, i.e., the digestion of sample, can however take up to several days. The ICP is very sensitive and easily detects to ppm (part per million) levels and for some elements to ppb (parts per billion) levels.
Chemical oxygen demand (COD) was measured based on U.S. EPA approved HACH method. The key apparatuses needed are COD Reactor (HACH 45600-00) for sample digestion, Colorimeter DR/700 (46000-00) with Module 61.01 (46261-00, 610 nm) for COD measurement (HACH Co., Loveland, CO). The reagent is the High Range+ COD digestion reagent (HACH 24159-25). It is prepared in individual vials and ready for use. The uniform sample, blended thoroughly in a high-speed blender for 3 minutes if necessary, was added to the reagent vial quantitatively. After digested in the COD Reactor for two hours, the sample was cooled down to room temperature. A blank was also prepared the same way except no sample was added. The digested sample was then measured in the DR/700 colorimeter against the blank. The result was shown instantly in the read-out window of the colorimeter based on a built-in calibration curve. To ensure the correct measurement, a calibration curve was also constructed periodically by measuring a set of known COD solutions. The comparison showed that the deviation of the built-in calibration curve was no more than 0.5% from that constructed manually. The detailed procedures are included in Appendix D for further references.
Heating values of TCC oil product were estimated based on the complete oxidation of carbon and hydrogen elements and by considering the oxygen content in the oil product. This equation follows (see Appendix A for detials):
Ht (kJ/kg)= f?(32,808?C + 120,967?H) + 9,280?S (1)
Where C, H, and S are the weight fractions of carbon, hydrogen, and sulfur in raw TCC oil product, respectively, and f (f = 1) is the correction factor which includes the effect of oxygen content on heating value. The test results of twenty compounds including oxygen- containing compounds showed that the standard deviation of the errors for the estimated heating values is 3.16% which is smaller than that calculated by the Dulong's equation in the literature, 7.16% (Sawayama et al., 1996; Selvig and Gibson, 1945). When used for the heating value estimation of TCC oil, the two equations gave very good agreement. The standard deviation of the relative errors was within 1% for ninety samples.
A Cole-Parmer (Vernon Hills, IL) bench pH meter and a glass electrode were used to measure pH values. The pH meter has a resolution of 0.01 and the accuracy of � 0.01 pH. It also has an ATC (automatic temperature compensation) system that is convenient for off- laboratory use.
The feedstock, swine manure slurry, was completely converted into different products: raw TCC oil, post-processed water, solid residues, and gases. The conversion rate of feedstock through this process was 100%. Therefore, the conversion rate was not considered as a parameter to characterize the TCC process as in other biomass conversion processes. The conversion process of swine manure to oil is similar to other biomass liquefaction processes. The conversion in this study is even easier in the sense that swine manure contains less lignin and the organic matter was finely "pre-processed" by hogs. On the other hand, less lignin means less energy content and results in less oil yield (Humphrey, 1979; Glasser, 1985). The biomass contained in swine manure has a high oxygen to carbon ratio and low hydrogen to carbon (Zahn et al., 1997; Hrubant et al., 1978). These affect the oil formation efficiency negatively because high oxygen content in organic matter implies low heating value. Addition of a reductive is necessary in direct liquefaction. According to preliminary test results, little or no organic carbon was converted to oil without the addition of a reductive reagent. Temperature had a substantial effect on the oil formation. It was also observed in preliminary study that the depolymerization reactions of organic matter would not occur until the temperature reached such a degree that the activation energy is overcome. In this study, the preferred operating condition for successful formation of TCC oil product was 285�C to 305�C, and the corresponding operating pressures were 6.8 MPa to 11.5 MPa. These conditions were much milder compared to the reported liquefaction processes of other biomass where the operating temperature and pressure were up to 400�C and 40 MPa, respectively (Elliot et al., 1988; Kranich, 1984; Appell et al., 1980). One of the notable phenomena was that at 275�C, the oil product did not form successfully in every run. This was presumably due to the complexity of the swine manure composition and the slight variation from batch to batch. Representative experiment results are summarized in Table 4.1.
The average of raw oil product yields for 90 runs is 53.8% with a standard deviation of 19.1%. The wide range of standard deviation is due to the variation of operation conditions. The highest rate of raw oil product yield was 79.9% and more than two thirds of the runs achieved a 50% or higher yield rate. The elemental composition, the benzene solubility, and heating values did not vary as much as the raw oil product yield. The averaged carbon and hydrogen composition was 70.8% � 4.5%wt and 9.0% � 0.5wt, with highest values of 77.9% and 9.83%, respectively. The average hydrogen to carbon molar ratio was 1.53. The nitrogen content was averaged at 4.1% with a standard deviation of 0.4%. About 3.3% of ash was present in the raw oil product. The oxygen content was calculated as the difference of the other mentioned elements and ash. Its average was 11.9%. Heating values were averaged to about 34,940 kJ/kg with a standard deviation of 1,590 kJ/kg. Moisture content of the raw oil product ranged from 10% to 14%. Eighty out of the 90 runs achieved a benzene solubility of raw oil product 70% or higher and the highest was 96.5%. The mean of the 80 runs was 79.5% as shown in Fig.4.1. A review of the literature shows the quality of TCC oil product is equivalent to those pyrolysis oils from wood sludge liquefaction (Rick and Vix, 1991).
Table 4.1 Representative experimental results of raw oil product.
| Group | Run #1 | Run #2 | Run #3 |
| Operating conditionsa | |||
| Temperature, �C | 285 | 295 | 350 |
| Pressure, MPa | 7.6 | 9.1 | 18.6 |
| Raw oil yield, % of VS | 59.2 | 70.2 | 69.0 |
| Elemental composition | |||
| Carbon, wt% | 71.2 | 73.6 | 77.9 |
| Hydrogen, %wt | 8.9 | 8.9 | 9.4 |
| Nitrogen, %wt | 4.1 | 3.9 | 4.6 |
| Sulfur, ppm | 0.21 | 0.17 | 0.13 |
| Oxygen, %wtb | 14.2 | 7.2 | 7.0 |
| Fixed solids, %wt of TS | 1.4 | 6.2 | 1.0 |
| Benzene solubility, % | 83.1 | 83.2 | 90.4 |
| Heating value, kJ/kg | 34,368 | 35,927 | 37,998 |
Figure 4.1 The distribution of benzene solubility of raw oil products.
The amount of the post-processed water was 82.2% of the input on average. About 2.2% of the organic matter and/or minerals were left in the processed water after the process. In the post-processed water, 2.2% was volatile solids and 1.3% fixed solids (minerals). The waste strength in the post-processed water was substantially reduced after the TCC process. The COD of a feedstock with 20% total solids was 237,400 � 1,200 mg/L. After the TCC process, the COD reduction rates were all greater than 50% except two out of 90 runs. The COD reduction rates ranged from 50% to 75% and the mean and standard deviation were 64.5% and 5.6%, respectively, with the highest value of 75.4%. The reduction rates that were higher than 60% accounted for 86.7% of the total 90 runs.
Figure 4.2 The distribution of COD reduction rates of ninety experiment runs.
It was also observed that the higher COD reduction rates are not necessarily associated with higher raw oil product yields. High operating temperatures and high CO initial pressures favor the formation of raw oil product. The active CO under high temperature kept the reaction system in a reductive environment that disfavors the COD reduction of the post- processed water. On the other hand, in the case of high temperature and low CO initial pressure, the COD reduction rate increased. For example, the COD reduction rate was 63% at operating temperature of 285�C. It was 70.5% at 325�C with low CO initial pressure. This is because less organic matter remained in the post-processed water when the raw oil conversion rates were high. Therefore, temperature is the most important operating parameter that affects the raw oil production and the waste reduction.
In the study, the nutrient content, nitrogen (N), phosphate (P), and potassium (K), of the post-processed water were measured for some runs. The NPK concentrations in the post-processed water were basically constant regardless of the operation conditions, as shown in Table 4.2. This is because the inorganic NPK from the feedstock essentially remained in aqueous solution. The major portion of the nitrogen in the feedstock was in nitrate form that dissolved in the aqueous solution. The NPK value is still too high to be discharged to a wastewater treatment system. If diluted, it could be used for irrigation under some specific conditions.
Table 4.2 Summary of the measurement results of the post-processed water.
| No. | N (ppm) | P (ppm) | K (ppm) |
| 1 | 6,300 | 4,196 | 1,130 |
| 2 | 6,300 | 4,330 | 1,471 |
| 3 | 6,300 | 4,062 | 1,200 |
| 4 | 7,300 | 4,089 | 1,352 |
| 5 | n.d. | 4,657 | 938 |
| 6 | n.d. | 4,552 | 929 |
Carbon dioxide (CO2) was the sole detectable gas by-product in the TCC process. The GC analysis results showed that no methane or other gases were produced. It was observed that CO2 production in the TCC process accounted for 20%wt or more based on the VS input. However, not this entire portion of the CO2 came from the VS although the element oxygen did. The carbon in the CO2 was mainly from the reductive reagent CO, which combined with element oxygen and formed CO2, and some from the depolymerization and decarboxylation reactions of the biomass where the carboxyl groups were thermally cleaved and the CO2 was released. It was the combination of CO with the element oxygen in the biomass that made the oil product of better quality. The CO consumption becomes an indicator of better oil product formation because CO eliminates elemental oxygen and chops polymers into small molecules that go towards crude oil-type products. The results showed that 42% of the CO was consumed on averaged based on VS input. The highest consumption rate was 88.9%, depending on the different operating conditions and CO initial addition. Although excessive CO addition resulted in a better oil quality, the advantage leveled off when the initial CO:VS ratio was 0.11 or higher.
Solid product was only a small portion of the total input. Based on the 90 runs under different condition, the solid product was about 3.3% of the total solids input. It contained dirt and char, some organic matter, and a small amount of minerals. However, depending on the operation conditions, the fixed solids (FS) had a wide content variation, ranging from 30% to 70%. With oil product yield of 60% or higher, the solid product was usually less than 1.5% of the total solids input and contained greater than 75% of the FS.
The products after the TCC process distributed into four different portions: raw oil product, gaseous product, solid product, and post-processed water. The amounts and composition of the different products varied according to the operation conditions. The input volatile solids distributed among all four products after the process, and the amount varied according to the operation conditions. According to the statistical results, a representative product distribution is summarized in Fig. 4.3.
In most experimental runs, the water content in the feedstock was 80% by weight and the CO introduction added about 1.8% more. Therefore, the percentage of water content consisted of 78.5% of the total input mass balance. After the TCC process, the amount of the post-processed water had a 4.4% increase compared to the feedstock. This was mainly due to the dissolvable organic matter and minerals remaining in the post-processed water.
|  |
Figure 4.3 Product distributions.
(a) Total mass balance;
(b) Volatile solids balance.
The VS in the feedstock distributed into the four different products including the post- processed water. Though the percentages in each portion varied widely according to the operating conditions, the major portion of VS was transferred into raw oil product. Solid product separated from the post-processed water was only 4.9% of the total and the VS in the solid product was about 7.8%. The portion of VS in the gas product was in the CO2 form that was converted from carbon element. The above product distributions are based on 90 experiments. Since the operating conditions were different from batch to batch, they present the TCC process on average. The effect of individual operating conditions on the TCC process is discussed separately later on in this report.
Temperature is the most important parameter in the TCC process and it was assigned as the representative factor for control scheme. When the reactor was heated, a liquid-vapor equilibrium established between the liquid water and its vapor in the closed system. The operating pressure was then coupled with the operating temperature through the saturated water vapor corresponding to that specified temperature. Therefore, the control of operating temperature is also controlling the operating pressure. Figure 4.4 depicts the effect of the operating temperature on the raw oil product yield and its solubility in benzene. The temperature range tested was from 270 to 350�C. Each data point represents the average of two or three replications. The error bars are the standard deviations of the replicated experimental results. It is seen from the figure that no oil product substantially yielded when the temperature was below 285�C. When temperature increased to 285�C, the raw oil product yield was increased to 56.9% of the total VS input with a standard deviation of 5.7%. As the temperature increased from 285�C through 335�C, the oil product yields increased in a small amount, from 57% to 64%. When the temperature was raised to 350�C, the oil yield experienced a drop back to 60%. The benzene solubility of the raw oil product followed the same increasing trend as the temperature increased. The value of the solubility increased from 80% at 285�C to 93% at 335�C. When the temperature further increased to 350�C, the benzene solubility decreased to 89.1%. The standard deviation of the averages varied from 3% to 10% throughout the temperature range. From the results we can see that increasing temperature helps to increase the oil yield and its solubility in benzene. However, if the temperature were too high, e.g., 350�C in our case, it would affect the process negative shown by the decrease of the raw oil yield and low oil solubility. It was found in the experiments that there was solid char formed at such a temperature. Some of the char dispensed in the post-processed water, which was categorized as the solid product and led to the drop of the oil yield. Some char remained in the raw oil product. However, the char would not dissolve in the solvent. This contributed to the low raw oil solubility. The formation of solid char was caused by the too high temperature and long retention time (120 minutes in this case). Once the oil product formed, it underwent an over-oxidation and was further thermally "chopped" into smaller molecules until to the bared char.
On the other hand, the overall content of carbon and hydrogen did not change much as the temperature increased from 285�C to 350�C. Figure 4.5 presents the results of elemental analyses of the temperature effect on the carbon and hydrogen content. Each data point represents the average of two or three replications. The error bars are the standard deviations of the replicated experimental results. From Fig. 4.5 we can see that as temperature increased from 285�C to 305�C, the carbon content was basically constant at about 70%wt of the oil sample. As temperature increased from 305�C to 350�C, the carbon content gradually increased from 70% to 78%. However, the hydrogen content in overall decreased as the temperature increased. From 285�C to 305�C, the hydrogen content was at about the same level of 9.5%wt. When temperature reached to 305�C and higher, the hydrogen composition in the raw oil product decreased from 9.6%wt to 9.1%. In terms of the H:C ratio, as illustrated in Fig.4.5, it was from 1.63:1 to 1.46 (molar ratio). This is an 11.6% relative difference. The repeatability of the oil solubility was better than that of the oil yields. The standard deviations of the oil solubility and the H:C ratio varied from 0.8% to 3.6% and from 0.07 to 0.2, respectively. The increase of benzene solubility of raw oil product with the increase of temperature was due to the oxygen element elimination at high temperatures. High operating temperature has the potential to enhance the oil yield. On the other hand, high operating temperature tends to eliminate oxygen element in the oil product. The compromise of the two outcomes led to the fluctuation of the oil yield through the temperature range and the constant increase of the oil solubility. It was concluded that temperature affects the TCC process significantly, especially on the oil product quality. Temperature has to be 285�C or higher for the oil formation process to occur. Temperature higher than 335�C is not recommended for its tendency to lead solid char formation.
Figure 4.4 Temperature effect on the raw oil product yield and its benzene solubility. The operating condition was CO:VS =0.07 (wt) or Pini = 0.69 MPa, RT = 120 minutes, TS = 20%, and feedstock pH = 6.0. The corresponding operating pressures were 7~18 MPa.
Post-processed water is the major portion of output after the TCC process. As most of the organic matter was converted into oil product, there was a small amount of the soluble organic matter remained in the post-processed water. It is the soluble organic and other reductive minerals that contribute to the COD of the post-processed water. Figure 4.6 is the illustration of the temperature effect on the COD reduction rates after the TCC process. As shown in Fig. 4.6, the COD reduction rate increased from 62% to 71% as the temperature increased from 275�C to 295�C. However, the COD reduction rates were at about the same level of 70% after 295�C. This reflects the same trend as the raw oil production rates for a similar reason. The high temperature promotes the reactive combination of CO with organic compounds and eliminates the oxygen element. Meanwhile, the CO also reduces the oxidative inorganic compounds to their reductive states, which contribute to the COD of the post-processed water. Some samplings showed that the carbon content in of the post- processed water at operating temperature of 285�C was 4.2%wt with a standard deviation of 0.4%wt. This includes both organic carbon and inorganic carbon such as the carbonates. This amount of carbon in the post-processed water is equivalent to a most possible COD of 112,000 mg/L. The COD measurements of the post-processed water after the process showed that the COD was 60,000~100,000 mg/L in the temperature range of 275~350�C, which agree to the carbon analysis result mentioned above.
Figure 4.5 Temperature effect on the composition of raw oil product: carbon and hydrogen. The operating condition was CO:VS =0.07 (wt) or Pini = 0.69 MPa, RT = 120 minutes, TS = 20%, and feedstock pH = 6.1. The corresponding operating pressures were 7~18 MPa.
Figure 4.6 Temperature effect on the TCC process: COD reduction rates. The operating condition was CO:VS =0.07 (wt) or Pini = 0.69 MPa, RT= 120 minutes, and feedstock pH = 6.1. The corresponding operating pressures were 7~18 MPa.
Retention time (RT) in this study was defined as the period of time maintained at the pre-set operating temperature. Retention time is a kinetic parameter and it affects the organic material conversion and product distribution. Insufficient RT will lead to incompleteness of the conversion process. Excessive RT will result in over-oxidization of the products and char formation. Figures 4.7 through 4.9 show the experimental results of RT effect on the raw oil product yield, oil solubility in benzene, and COD reduction rate at three different temperatures. Each data point in the plots represents an average of two or three replications and the error bar showing its standard deviation is omitted to focus the trend of the RT effect on the TCC process. It is seen from Fig.4.7 that the RT had a strong relationship with the raw oil product yield at 285�C. As the RT increased from 30 to 120 minutes, the oil yield increased from 12% to 57%, correspondingly, based on the initial VS input. This indicates that the depolymerization occurred gradually at such relatively low temperature. The increasing RT helped the completeness of organic conversion process thus increasing the oil yield. However, the relationship between the RT and oil yield at 295�C and 305�C was not as strong as that at 285�C. The oil yields reached to 60% or higher right after the temperatures reached 295�C or 305�C. Unlike at 285�C, the oil yields decreased as the RT extended to 120 minutes. It is necessary to point out that the oil yields at 295�C were always higher than that at 305�C throughout the RT range, except at RT = 30 minutes, where the oil yield at 305�C had a bump. This may be explained by the raw oil quality verses its amount of yield. At 305�C the oil product contained less oxygen content and the amount or oil yield reduced, see Figure 4.8.
Figure 4.7 Effect of retention time on raw oil product yield at three different temperatures. The operating condition was: CO:VS =0.07 (wt) or Pini= 0.69 MPa, TS = 20%wt, and feedstock pH = 6.1. The corresponding operating pressures were 7.6, 9.1, and 10.2 MPa, respectively.
Figure 4.8 shows the relationship between the benzene solubility of the raw oil products and RT. The oil solubility at 285�C increased as RT increased from 30 minutes to 90 minutes and levels off thereafter at 76%. Comparing to that at 285�C, the oil solubility at 295�C showed higher values of about 70% at RT less than 60 minutes, but increased slowly until RT = 120 minutes when the increment was from 74% to 85%. The oil solubility at 305�C was at the same level as that at 295�C when RT = 30 minutes and the highest when RT = 60minutes. The better oil quality, indicated by high oil solubility in benzene solvent, was compromised by a lower oil yield.
The RT also affected the COD reduction rate. Figure 4.9 shows that RT effect on the COD reduction rates at three different temperatures. In overall, the COD reduction rate increased as the RT increased. However, the increase rates were different. AT 285�C, the COD reduction rate increased about 20% when RT increased from 30 to 90 minutes and level off until 120 minutes, from 65% at RT = 60 minutes to about 80% at RT = 90~120 minutes. Meanwhile the rates increased about 10% for that at 295�C and 305�C, from 60% to 75%. It is noticed that the COD reduction rates at 285�C were higher that those at 295�C and 305�C when RT was from 60 to 120 minutes. One possible explanation is that water- soluble organic matters were not completely oxidized due to highly active CO at 295�C and 305�C. There were also some minerals and other inorganic compounds remained in the post-processed water. These water-soluble and reductive compounds contributed to high COD in the post-processed water.
Figure 4.8 Retention time effect on the benzene solubility of raw oil product. The operating condition was: CO:VS =0.07 (wt) or Pini = 0.69 MPa, TS = 20%wt, and feedstock pH = 6.1. The corresponding operating pressures were 7.6, 9.1, and 10.2 MPa, respectively.
Figure 4.9 Retention time effect on COD reduction rates. The operating condition was CO:VS =0.07 (wt) or Pini = 0.69 MPa, TS = 20%wt, and feedstock pH = 6.1. The corresponding operating pressures were 7.6, 9.1, and 10.2 MPa, respectively.
pH values are an indication of the strength of acidity/alkalinity, i.e., the concentration of hydrogen ion (H+) or hydroxyl groups (-OH) in the feedstock or post-processed water. The hydrogen ions or hydroxyl groups affect the biomass conversion process by serving as a catalyst for the hydrolysis of cellulose and other carbohydrates and polymers. Large deviation of pH from neutral value, either too high or too low, will affect the chemical process of the system, and may create severe chemical erosion of the apparatus under high temperatures as well.
It was found that the pH value of the natural fresh manure used in this study was virtually constant at pH = 6.06 with a standard deviation of 0.17. The pH value in this study is relatively lower comparing with the statistical pH value of 7.5 � 0.57 in swine manure slurry (ASAE, 1997). One of the findings was that the fresh swine manure had a strong buffer capacity. Experiments showed that it took 8 grams of NaOH or 26.7 grams of H3PO4 to bring one kilogram of 20% solids fresh manure (pH = 6) to pH = 10 or 4, respectively. This is assumed to be due to the chemical reactions that consumed some of the hydrogen ions or hydroxyl radicals of Lewis acids or bases such as amino acids and nitrogen- containing compounds.
To investigate the pH effect, we adjusted the pH of feedstock to the desired levels by adding NaOH or H3PO4 according to pre-determined titration curves. The pH value of the post-processed water after the process was close to those of the feedstock, however, they were not completely controlled as shown in Table 4.3. The experimental results on yield of raw oil product, benzene solubility of raw oil product, and COD reduction rates are illustrated in Fig. 4.10.
Table 4.3 pH values of feedstock and post-processed water when the feedstock pH was controlled.
| Before the runs | After the runs |
| pH = 4 | 4.46 � 0.14 |
| pH = 7 | 6.04 � 0.22 |
| pH = 10 | 7.41 � 0.18 |
From the results, we found that raw oil product yield was the highest of the three at pH = 10, about 73% and the other two were at essentially the same level, around 55%. However, the highest benzene solubility occurred at pH = 7, about 80%. In other words, the process yielded a better quality oil product at neutral pH. The benzene solubility was about 70% at pH = 10. It is known that low pH (high H+) helps the hydrolysis of polymers, thus helps the depolymerization process. Unexpectedly, the lowest benzene solubility occurred at pH = 4. The COD reduction rates were virtually the same for all three pH values.
Figure 4.10 Experimental results with controlled feedstock pH. The operating conditions were 285�C and 7.5 MPa, CO:VS =0.07 or Pini = MPa, RT = 120 minutes, initial TS = 20%.
It was found that the CO addition to the system is critical to the success of the TCC process. Without CO addition, there was no oil product forming. Carbon monoxide serves as reductive reactant in the TCC process. The presence of CO eliminates the oxygen element in the raw oil product by reacting with hydroxyl and/or carboxyl groups and releasing the CO2. In the constant-volume TCC reactor, the initial pressure of CO, Pini, introduced into the TCC reactor is proportional to the initial amount of CO added. The ratio of CO to VS in the feedstock is a parameter that will affect the yield and quality of the raw oil product. The experimental results of Fig. 4.11 showed that the yield of raw oil product increased as the CO:VS increased, from 55% to 65%. In other words, the higher the CO initial pressure, the higher the yield of raw oil product. This is because higher CO initial pressures created a more reductive atmosphere that reduced the chance of over-oxidation of carbon into CO2. The benzene solubility of the raw oil product leveled at about 78% at different CO:VS ratios. It did not increase as expected with the increase of CO:VS ratio. It was found that CO did not have enough reaction activity at temperature of 285�C or lower. The excessive CO would not help the elimination of oxygen element unless the CO combines with hydroxyl or carboxyl groups and release CO2. This has been verified by the results of temperature effect study (see section of Temperature Effect.).
Figure 4.11 Effect of initial CO:VS ratio on the TCC process. The operating conditions were T = 285�C, P = 7.5 ~ 11 MPa, RT=120 minutes, and TS = 20%wt, and feedstock pH = 6.1.
The COD reduction rates were almost constant at about 64% when CO:VS ratio was 0.2 or lower. At CO:VS ratio of 0.25, the COD reduction rate dropped to 50%. This is due to the same reason as that in the retention time effect, i.e., higher concentration of CO in the water phase prevented the water-solubles from oxidation.
Solids content is another major parameter affecting the TCC process. Based on feedstock solids measurement, the total solids of the fresh manure were 27.4%wt. Among the total solids, 87.3%wt of TS were volatile. Since the volatile solids are the fraction of the manure that could be converted to oil products, high volatile solids content is desirable. However, manure with 25% by weight or more total solids content is difficult to pump. Manure with less than 10% total solids is easier to pump, but may not be efficient and economical. To explore the effects of solids contents on the TCC process, four different solids levels, 10%, 15%, 20%, and 25% were tested. The experimental results are summarized in Fig. 4.12.
These results show that the yields of raw oil product vary significantly as the TS contents change from 10%wt to 25%wt. When TS was less than 15%, oil product yields are less than 30%. Also, the repeatability of the experiments was poor at low TS values. At TS = 15%, the standard deviation of the oil product yields was � 5.8%, or a coefficient of variation of 23%. This phenomenon is even worse at TS = 10%wt. Not all of the runs at TS = 10% were successful. About half of the runs with TS=10% did not yield any raw oil product. This phenomenon also happened at TS = 15% occasionally. When the total solids content was 20% or higher, the yields of raw oil product reached 60% or higher, and the repeatability was much better. The standard deviation for raw oil yield and COD reduction rate was usually within 6%. Therefore, a high TS is desirable for the purpose of oil production.
Figure 4.12 Oil yields, solubility and COD reduction rates verses total solids content. The operating conditions were 285�C, RT = 120 minutes, CO:VS =0.07 or Pini = 0.69 MPa, initial TS = 20% with natural initial feedstock pH=6.1.
There is no clear understanding why low TS leads to low or no raw oil product formation. A possible explanation follows. The feedstock (biomass polymers) breaks down thermochemically. The small molecules need a micro organic phase for the oil formation reactions to occur. This micro organic phase could be small droplets distributed uniformly in the water slurry. Because of the minerals and strong polar radical groups contained in the biomass (e.g. -COOH, -SH, and �NH2), some of the molecules dissolve in the water phase, especially at high temperatures. If the TS is low, it is likely that more organic molecules are completely surrounded by water molecules. This diminishes the possibilities of organic cluster formation to a great extent and provides no reacting media for oil product formation reactions. On the other hand, once organic clusters form, they will accelerate the oil formation process and the organic cluster gather together to form a continuous oil phase at top of the water phase until the conversion process completes.
The COD reduction rates increased from 50% to 60% as the TS increased. It indicates that the higher the TS level, the better the waste reaction rate. The benzene solubility of raw oil product ranged from 73.5% to 80.5%. Unlike the yield of raw oil product and COD reduction rate, the benzene solubility of the raw oil product decreases slightly as the TS increases, from 80% to 73.5%. The relative difference between the two is about 8%.
A TCC oil product was successfully achieved through the liquefaction of swine manure by using carbon monoxide (CO) as the reductive reagent. It was shown that temperature played a key role in such as process with CO addition. Since the depolymerization reactions of ligno-cellulosic polymers occurred in liquid phase, it was assumed that the total operating pressure would not affect the process. Instead, the partial pressure of the CO present would play an active role in the process because the partial pressure of the CO in the gas phase would affect the solubility in the liquid phase, water slurry in this case.
To verify this assumption that total operating pressure does not affect the process, nitrogen (N2) gas was added to supplement the reduced application of CO and maintain the same level of total operating pressure under same temperature. No negative effect was found when N2 was added. A logical thinking then followed that how the N2 alone affect the process? A set of experiments was conducted to explore the nitrogen effect. The results are summarized in Table 5.1.
Table 5.1 Nitrogen addition effect on the TCC process. The operating conditions were 285�C, RT = 120 minutes, TS = 20%wt with natural initial feedstock pH.
| P | Initial gas (MPa) | Raw oil product (%wt) | COD redu. | ||||||
| No. | (MPa) | CO | N2 | Yield | Solubility | C | H | N | (%) |
| 1 | 7.6 | 1.38 | 0.00 | 59.2 | 83.1 | 71.2 | 9.0 | 4.1 | 61.7 |
| 2 | 10.2 | 1.38 | 1.24 | 52.7 | 77.9 | 65.2 | 9.1 | 4.4 | 65.5 |
| 3 | 8.3 | 0.69 | 0.69 | 45.2 | 77.7 | 68.3 | 9.2 | 4.7 | 68.2 |
| 4 | 8.4 | 0.69 | 1.24 | 53.9 | 76.3 | 70.6 | 9.2 | 4.9 | 68.5 |
| 5 | 7.6 | 0.00 | 1.24 | 32.7 | 66.9 | 74.9 | 9.6 | 7.1 | 68.8 |
| 6 | 8.0 | 0.00 | 1.30 | 49.6 | 70.2 | 70.8 | 9.3 | 5.8 | 63.8 |
| 7 | 8.1 | 0.00 | 1.24 | 48.8 | 71.2 | 70.9 | 8.9 | 5.7 | 63.9 |
| 8 | 7.3 | 0.00 | 0.34 | 0.0 | - | - | - | - | 71.2 |
| 9 | 7.2 | 0.00 | 0.00 | 0.0 | - | - | - | - | 67.0 |
| 10* | 9.4 | 0.00 | 0.00 | 0.0 | - | - | - | - | 72.5 |
The results showed that with N2 addition, combining with addition of CO, the process achieved a success of yielding an oil product. It was also successful when N2 alone was applied as in runs #5, #6, and #7. The oil elemental composition remained basically the same with slightly reduced oil yield and benzene solubility. If the N2 initial pressure was 0.34 MPa (50 psi) or no N2 under 285�C, there was no oil product yielded (runs #8 and #9) as in the same situation with CO addition alone. Is it because of the low total operating pressure? This was tested through raising the operating temperature to 305�C that was corresponding to an operating pressure of 9.4 MPa. This pressure was higher than the previous runs and had been proved the workable condition to yield oil product in with CO addition. Therefore, it was concluded that N2 has the similar effect like CO that promotes the oil product formation. The chemical principle behind it, however, is unknown.
To explore the gas addition effects on the TCC process, experiments and lab analysis are on going. The inert gases of nitrogen and carbon dioxide, hydrogen, and the compressed air are also experimented through the same process. The operating parameter effects are also considered in this study.
Heating value or heat of combustion is a thermodynamic property of a substance. It indicates the energy content in the substance. Heating value is defined as the amount of heat evolved by the complete combustion of a unit amount of the substance. In metric system, heating value is usually in the unit of kilo-joules per mole of the substance (kJ/mol). The heating values for ethanol (C2H5OH) and propane (C3H8) are 1,367.7 kJ/mol and 2,221.4 kJ/mol, respectively (Weast, 1983). If converting the two values into per unit weight basis, they are 29,688 kJ/kg and 50,376 kJ/kg, respectively. It is obvious that propane contains more energy than ethanol does. This is due to the high H to C molar ratio in propane (H:C = 2.67:1) and the oxygen content (~35%wt) in ethanol.
Heating value of a substance is usually measured experimentally with a standard calorimetric method. However, it is convenient to estimate the heating value for cases there the standard value is not available and the exact value is not crucial. Estimation of heating value is even more useful when the material to be dealt with is a mixture of organic matters. When the composition of the mixture changes from case to case, it is handy to estimate the heating value based on an elemental analysis such as in coal evaluation. Selvig and Gibson (1945) had summarized many different equations that used in the caloric value estimation. One of the most widely used is the Dulong's formula:
Converting into metric units, above equation becomes
Ht (kJ/kg)= 33,823?C + 144,250?(H-O/8) + 9,419?S (6-2)Where Ht is the heating value; C, H, S, and O are the fractions of the elements of carbon, hydrogen, sulfur, and oxygen in the substance, respectively. The error of the heating values calculated by Dulong's equation was within 1.5% compared to that measured in the oxygen- bomb calorimeter for different types of coal (Selvig and Gibson, 1945). For biomass- derived oils, its elemental composition is usually uncertain from batch to batch and calorimetric measurement of heating value for each experimental sample is not necessary. Some researcher then borrowed the equations from that used in caloric value estimation of coal to estimate the heating value of their pyrolytic oils. For example, Sawayama et al. (1996) used the Dulong's equation in their research. To guide our research promptly, we also used an equation to estimate the heating value of our raw TCC oil, which was developed based the complete combustion of carbon, hydrogen, and sulfur.
Carbon, hydrogen, and sulfur can be completely combusted forming their highest corresponding oxides according to the following equations:
C + O2 ⇒ CO2 � 93.963 kcal/mol (-32,753 kJ/kg C) (6 � 3)The heating value of a substance is then the summation of the combustion heat of C, H, and S. However, not all of the C and H in the TCC oil form C-C and C-H bonds. Some of the C and H combine with the element oxygen forming C-O and H-O bonds. These C-O and H-O bonds have been oxidized partially, therefore, they do not contribute to the heating value anymore. Because of the complexity of the composition in the TCC oil, it is impossible to predict the portion of C-O and H-O bonds. Each carbon in organic matter contains four available bonds, each hydrogen has one available bond, and each oxygen has two available bonds. By observation of some compounds that contain element oxygen, a fraction of 7/8 oxygen was assumed to be the bonds that combine with C and/or H (the rest is the O-O bonds). The equation is then in the following form:
Ht (kJ/kg) = f?(32,808?C + 120,967?H) + 9,280?S (6-6)Where Ht is the heating value; C, H, S, and O are the fractions of elements of carbon, hydrogen, sulfur, and oxygen in the TCC oil product, respectively; and f is the correction factor that including the oxygen effect of the overall heating value.
Comparing to that of Dulong's equation, the above equation is actually its modification, i.e., the form of correction factor.
This empirical equation was tested through twenty compounds that contain carbon, hydrogen, oxygen, and nitrogen. The oxygen content of the tested compounds was as high as 53.3%wt. As a comparison, the Dulong's equation (Eq. 6-2) is also used to perform the same estimation. The results are summarized in Table 6-1. The results show that the average of the errors is +1.69% for the estimated heating values and the standard deviation of the errors is 3.16%. The best and worst estimations are +0.66% and +5.86%, respective, using Eq. 6-6. The Dulong's equation gives the best estimation of +0.72% and the worst of �15.9%. The average of the errors using Dulong's equation is �2.53% and the standard deviation of the errors is 7.61%. Overall, the self-defined equation (Eq. 6-6) gives an over- estimation and the Dulong's equation (Eq. 6-2) gives an under-estimation. Relatively, the self-defined equation gives a better estimation. In the calculation of heating values of TCC oil, the two equations agree to each other very well. The average of the relative errors estimated by the two equations is +0.93% with a standard deviation of 0.82%. Some examples are listed in Table 6.1.
Table 6.1 Examples of heating value estimations.
| Composition of TCC oil, % | Heating values, kJ/kg | Relative | ||||||
| No. | C | H | S | N | ash | By Eq. D-6 | By Eq. D-2 | Error, % |
| 1 | 74.93 | 9.64 | 4.36 | 0.23 | 2.02 | 37,176 | 37,682 | 1.34 |
| 2 | 73.17 | 8.82 | 4.91 | 0.20 | 10.6 | 36,222 | 37,076 | 2.30 |
| 3 | 72.24 | 9.79 | 4.15 | 0.27 | 4.97 | 36,534 | 37,033 | 1.35 |
| 4 | 73.80 | 9.35 | 4.11 | 0.21 | 35,945 | 36,209 | 0.73 | |
| 5 | 72.57 | 8.94 | 4.68 | 0.18 | 3.27 | 35,223 | 35,591 | 1.03 |
| 6 | 67.47 | 9.13 | 3.79 | 0.21 | 3.71 | 33,169 | 33,182 | 0.04 |
| 7 | 72.17 | 9.13 | 4.22 | 0.20 | 2.67 | 35,209 | 35,505 | 0.83 |
| 8 | 73.38 | 9.30 | 3.85 | 0.19 | 1.96 | 35,880 | 36,210 | 0.91 |
| 9 | 72.85 | 9.35 | 4.20 | 0.20 | 3.57 | 35,959 | 36,375 | 1.14 |
| 10 | 6.50 | 8.88 | 3.77 | 0.23 | 4.94 | 32,501 | 32,495 | -0.02 |
| 11 | 75.52 | 9.49 | 4.40 | 0.16 | 1.07 | 37,087 | 37,561 | 1.26 |
| 12 | 73.63 | 8.97 | 4.31 | 0.20 | 1.36 | 35,475 | 35,783 | 0.86 |
| 13 | 71.98 | 9.01 | 4.06 | 0.17 | 1.26 | 34,746 | 34,922 | 0.50 |
| 14 | 71.16 | 8.99 | 4.06 | 0.21 | 1.37 | 34,368 | 34,495 | 0.37 |
| 15 | 76.18 | 9.53 | 4.21 | 0.18 | 1.08 | 37,425 | 37,939 | 1.35 |
| 16 | 73.44 | 9.56 | 3.92 | 0.19 | 1.34 | 36,238 | 36,564 | 0.89 |
| 17 | 77.95 | 9.37 | 4.57 | 0.13 | 1.00 | 37,998 | 38,634 | 1.65 |
| 18 | 76.85 | 9.24 | 4.00 | 0.13 | 1.90 | 37,346 | 37,914 | 1.50 |
| 19 | 73.61 | 8.93 | 3.91 | 0.17 | 6.16 | 35,927 | 36,492 | 1.55 |
Table 6.2 Estimation of heating values by the self-defined equation and the Dulong's equation (Selvig and Gibson, 1945).
| No. | Chemical Name | Formula | weight | Element composition (%wt) | Correction | Literature | Calculated values | ||||||
| factor | heating value | Self-defined Eq. | Dulong Eq. | ||||||||||
| (g/mol) | C | H | O | N | f | (kJ/kg) | kJ/kg | error % | kJ/kg | error % | |||
| 1 | Propane | C3H8 | 44.1 | 81.64 | 18.14 | 0.00 | 0.00 | 1.0000 | 50,376 | 52,479 | 4.01 | 53,793 | 6.35 |
| 2 | t-Butanol | C4H10O | 74.1 | 64.76 | 13.49 | 21.59 | 0.00 | 0.9423 | 35,546 | 37,635 | 5.55 | 37,479 | 5.16 |
| 3 | n-Hexane | C6H14 | 86.2 | 83.55 | 16.25 | 0.00 | 0.00 | 1.0000 | 48,342 | 50,414 | 4.11 | 51,703 | 6.50 |
| 4 | n-Butyric acid | C4H8O2 | 88.1 | 54.48 | 9.08 | 36.32 | 0.00 | 0.8750 | 24,799 | 26,245 | 5.51 | 24,980 | 0.72 |
| 5 | Glycerol | C3H8O3 | 92.1 | 39.09 | 8.69 | 52.12 | 0.00 | 0.7750 | 18,048 | 18,532 | 2.61 | 16,357 | -10.3 |
| 6 | Phenol | C6H6O | 94.1 | 76.50 | 6.38 | 17.00 | 0.00 | 0.9500 | 32,467 | 32,113 | -1.10 | 32,013 | -1.42 |
| 7 | Benzoic acid | C7H6O2 | 122.1 | 68.78 | 4.91 | 26.20 | 0.00 | 0.9118 | 26,441 | 26,462 | 0.08 | 25,631 | -3.16 |
| 8 | Naphthalene | C10H8 | 128.2 | 93.62 | 6.24 | 0.00 | 0.00 | 1.0000 | 40,237 | 39,520 | -1.81 | 40,677 | 1.08 |
| 9 | Leucine | C6H13O2N | 131.2 | 54.89 | 9.91 | 24.40 | 10.67 | 0.9189 | 27,310 | 29,009 | 5.86 | 28,469 | 4.07 |
| 10 | Salicylic acid | C7H6O3 | 138.1 | 60.82 | 4.34 | 34.75 | 0.00 | 0.8676 | 21,898 | 22,055 | 0.71 | 20,573 | -6.44 |
| 11 | Xylose | C5H10O5 | 150.1 | 39.97 | 6.66 | 53.29 | 0.00 | 0.7500 | 15,589 | 15,966 | 2.36 | 13,520 | -15.3 |
| 12 | Vanilin | C8H8O3 | 152.1 | 63.10 | 5.26 | 31.55 | 0.00 | 0.8875 | 25,154 | 24,434 | -2.95 | 23,241 | -8.23 |
| 13 | a-D-Glucose | C6H12O6 | 180.2 | 39.97 | 6.66 | 53.29 | 0.00 | 0.7500 | 15,569 | 15,966 | 2.48 | 13,520 | -15.2 |
| 14 | Tyrosine | C9H11O3N | 181.2 | 59.61 | 6.07 | 26.49 | 7.73 | 0.9043 | 24,730 | 24,994 | 1.06 | 24,146 | -2.42 |
| 15 | Lauric acid | C12H24O2 | 200.3 | 71.88 | 11.98 | 15.97 | 0.00 | 0.9583 | 36,853 | 38,572 | 4.46 | 38,723 | 4.83 |
| 16 | Indigo | C16H10O2N2 | 262.3 | 73.21 | 3.81 | 12.20 | 10.68 | 0.9595 | 28,976 | 27,999 | -3.49 | 28,068 | -3.24 |
| 17 | Stearic acid | C18H36O2 | 284.5 | 75.93 | 12.65 | 11.25 | 0.00 | 0.9722 | 39,680 | 41,435 | 4.24 | 41,915 | 5.33 |
| 18 | Arachidic acid | C20H40O2 | 312.5 | 76.79 | 12.8 | 10.24 | 0.00 | 0.9750 | 40,536 | 42,046 | 3.59 | 42,597 | 4.84 |
| 19 | Sucrose | C12H22O11 | 342.3 | 42.07 | 6.43 | 51.42 | 0.00 | 0.7643 | 16,490 | 16,601 | 0.66 | 14,231 | -15.9 |
| 20 | Narcotine | C22H23O7N | 413.4 | 3.86 | 5.56 | 27.09 | 3.39 | 0.9054 | 26,782 | 25,629 | -4.50 | 24,743 | -8.24 |
1. American Public Health Association, American Water Works Association, and Water Pollution Control Federation. 1989. Standrad Methods for the Examinations of Waterr and Wastewater, 17th edition. American Public Health Association, Washington, D.C.
2. Brown, R. C. 1994. Conversion technology. In: The potential for Biomass Production and Conversion in Iowa. Final report to Iowa Energy Center (personal communication).
3. Chornet, E. and R.P. Overend. 1985. Biomass liquefaction: an overview. In Fundamentals of Thermochemical Biomass Conversion. eds. R. P. Overend, T. A. Milne, and L. K. Mudge, 967-1002. Elsevier Applied Science, New York, NY
4. Datta, B.K. and C.A McAuliffe. 1993. The production of fuels by cellulose liquefaction. In Proceedings of First Biomass Conference of the Americas: Energy, Environment, Agriculture, and Industry. 2:711.
5. Duun, B. S., J. D. Mackenzie, and E. Tseng. 1976. Conversion of cattle manure into useful products. EPA-600/2-76-238. US Environmental Protection Agency. Ada, OK
6. Farris, S.G. and S.T. Weeks. 1996. Commercial demonstration of biomass gasification the Vermont project. In Bioenergy '96: Partnerships to Develop and Apply Biomass Technologies, eds. ???, 44-51. ??city:?? association
7. Garner, W. and I.C. Smith. 1973. The disposal of cattle feedlot wastes by pyrolysis. EPA-R2-73-096. U.S. Environmental Protection Agency, Washington, D.C.
8. Glasser, W.G. 1985. Lignin. In Fundamentals of Thermochemical Biomass Conversion. eds. R. P. Overend, T. A. Milne, and L. K. Mudge. 61-76. Elsevier Applied Science, New York, NY.
9. Hrubant, G.R., R.A. Rhodes, and G.H. Sloneker. 1978. Specific composition of representative feedlot wastes: a chemical and microbial profile. Science and Education Administration, U.S. Department of Agriculture, Washington, D.C.
10. Humphrey, A.E. 1979. The hydrolysis of cellulosic materials to useful products. In Hydrolysis of Cellulose: Mechanisms of Enzymatic and Acid Catalysis, eds. R.D. Brown, Jr. and L. Jurasek, p27. American Chemical Society, Washington, D.C.
11. Kreis, R. D. 1979. Recovery of by-products from animal wastes � a literature review. Report for the US Environmental Protection Agency: EPA-600/2-79-142. Robert S. Kerr Environmental Research Laboratory, U.S. EPA. Ada, OK.
12. Microanalysis Laboratory, 1998. A Guide To Microanalysis Services. (also available at http://www.scs.uiuc.edu/~micro/ by January, 1999). University of Illinois at Urbana-Champaign, Urbana, IL
13. Miner, J.R. 1995. A review of the literature on the nature and control of odors from pork production facilities. National Pork Producers Council, Des Moines, IA.
14. Parr Instrument Company, 1998. Manual for high pressure reactors 4570/80, Item No. 253M. Moline, IL.
15. Primentel, D., and G. Rodrigues. 1994a. Renewable energy: economic and environmental Issues. BioScience. 44(8) (also available at "http://www.dieoff.org/page84.htm" by January 1999).
16. Sawayama, S., S. Inoue, K. Tsukahara, and T. Ogi. 1996. Thermochemical liquidization of anaerobically digested and dewatered sludge and anaerobic retreatment. Bioresource Technology 55:141-4.
17. Selvig, W.A., and F. H. Gibson. 1945. Calorific value of coal. In Chemistry of Coal Utilization. Eds. H.H. Lowry. Vol 1, p132-143.
18. Smith, S.L., R.G., Graham, and B. Freel. 1993. The development of commercial scale rapid thermal processing of biomass. In Proceedings of First Biomass Conference of the Americas: Energy, Environment, Agriculture, and Industry. 1194- 1200. (Burlington. VT Aug 30 - Sep 2).
19. Starling, K.E. and M.S. Han, 1972. Thermo Data refined for LPG, part 14: Mixtures. Hydrocarbon Processing, 51(5):129-132.
20. Stith, P. and J. Warrick 1996. Boss Hog. The Amicus Journal. Spring '96, 36-42.
21. Trenka, A.R. 1996. Preliminary operational experience from the biomass gasification facility (BGF) in Paia. Hawaii. In Bioenergy '96: Partnerships to Develop and Apply Biomass Technologies, 37-43
22. U.S. Congress, Office of Technology Assessment. 1980a. Energy from Biological Processes. Vol. I. Washington, D.C.
23. USDA 1997, Agricultural Statistics 1997, Table 7-33, VII-24, United States Government Printing Office. Washington, D.C.
24. US Department of Energy 1996. Annual energy outlook 1997 with projections to 2015. Washington, D.C.
25. Weast, R. C. (ed.) 1983. CRC Handbook of Chemistry and Physics. p B-82. CRC Press, Inc. Boca Raton, FL.
26. White, R.K. and E. P. Taiganides 1971. Pyrolysis of livestock manure, Livestock manure Management, the Proceedings of 2nd International Symposium on Livestock manure, 190-191, 194.
27. Zahn, J.A., J.L. Hatfield, Y.S. Do, A.A. DiSpirito, D.A. Laird, and R.L. Pfeiffer 1997. Characterization of volatile organic emissions and wastes from a swine production facility. J. Environ. Qual. 26:1687-1696.
Dr. Joanne Chee-Sanford, Department of Animal Sciences, UIUC, is gratefully acknowledged for her help and generosity in using her laboratory and GC to perform the gas analysis.