![]()
CALGON CARBON CORPORATION
|
|
|
|
Comparing two GAC's for Adsorption and Biostabilization |
||||||
GAC operated in the adsorption mode removes larger amounts of DBP precursors than does GAC manufactured as a substrate for biological activity, but the former requires frequent regeneration to maintain its high performance. Mark A.Carlson, Kevin M.Heffernan, Craig C.Ziesemer, and Edwin G.Snyder The removal of organic materials by biological activity is gaining greater attention as regulations become stricter and bacterial re-growth is better understood. This article compares two types of granular activated carbon (GAC) for removing the precursors of disinfection by-products. One GAC was a coal-based carbon manufactured as an adsorbent, and the other was a wood-based carbon manufactured primarily as a substrate for biological activity. After a year-long pilot-scale evaluation, the performance of the two GACs was compared. Once the GAC systems had reached a plateau, there was little difference in the performance of the two carbon types; they removed about 15-20 percent of the precursor material. The GAC manufactured for adsorption, however, removed seven times more total organic carbon than did the other GAC. In water treatment, granular activated carbon (GAC) has been used mainly for taste and odor control, with some special applications that remove synthetic organic chemicals (SOCs) or volatile organic chemicals (VOCs) from contaminated water. The 1986 Safe Drinking Water Act amendments called for the establishment of a Disinfectants-Disinfection By-product (D-DBP) Rule, which may change the role of GAC in drinking water treatment. GAC can help utilities comply with the D-DBP Rule by
Historically, the role of biological treatment has been associated with slow sand filtration. Although originally reluctant to use microorganisms, the US water industry is becoming more aware of the possible uses of biological removal mechanisms. Biological removal has long been recognized and promoted in Europe. In 1982, the Netherlands had eight full-scale plants with carbon filtration to encourage biological activity.1 Germany has shown much interest in biological treatment,2 and France has operated biological GAC filters. Carbon manufactured for bio-stabilization is a relatively new concept in the United States, but acceptance of biological activity for the removal of organic compounds is increasing. GAC solely for biological applications is now being marketed.* Referred to in this article as GAC B, this carbon has some adsorptive capacity but is being marketed as a companion process to ozone to provide biological stabilization. The objective of this article is to compare and contrast GAC B with GAC A, the latter being a more common carbon marketed as an adsorbent material. The two carbons were compared in terms of their ability to remove precursors of disinfection by-products. The performances of the two carbons were compared under conditions typical of water treatment during different seasons. _______
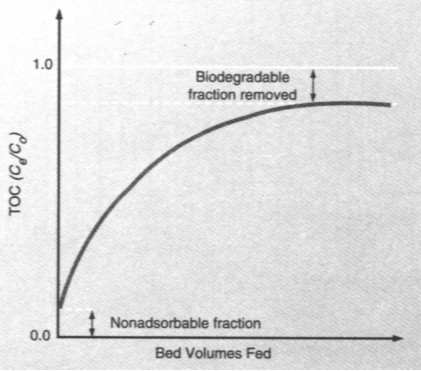
Two types of GAC were studied for their ability to remove organic materials. Background The performance of GAC is typically evaluated with a breakthrough profile that characterizes its removal of target compounds. A typical total organic carbon (TOC) breakthrough curve is illustrated in Figure 1. Removal of the contaminant is normalized on the ordinate with an effluent-to-influent ratio of concentration (Ce/Co). A fraction of the TOC is typically non-adsorbable and will pass through the GAC column. This results in the breakthrough curve commencing at a Ce/Co ratio that is greater than zero. Following a transition period, the breakthrough profile remains nearly constant with increasing bed volumes passed. In this article, the term plateau refers to the horizontal part of the breakthrough curve. At plateau, the removal does not show a trend; rather, it varies about a mean. At plateau, adsorption is assumed to be complete, and biological degradation is responsible for any reduction in organics. The amount of water treated to reach the plateau state is often thought to be representative of the adsorptive capacity of GAC. FIGURE 1 Typical breakthrough curve for TOC
Determining the fraction of target compound removal that is attributable to adsorption or biological activity is difficult. A theoretical representation of dissolved organic carbon (DOC) removed by adsorption and biological activity is shown in Figure 2. Initially, the primary removal mechanism is adsorption. As sites on the GAC become occupied, adsorption becomes less effective. Under plateau conditions (after five to 20 days), biological degradation is the predominant mechanisms for removal of organics. Biological oxidation in GAC beds has long been suspected but is difficult to quantify. Speitel et al4 radio-labeled SOCs to allow their fate to be studied. The results obtained support to a great extent the theory represented in Figure 2. FIGURE 2
Theoretical
representation of DOC removal by adsorption and
Approach Testing facilities. Pilot testing was undertaken in the filter building of the Moores Bridges water treatment plant in Norfolk, Va. The pilot plant, divided into two trains, was designed by a contracted consulting firm* (Figure 3). Water was obtained from sedimentation basins 5 and 6 at the Moores Bridges plant after clarification. This settled water (typically near pH 6.7) was pumped to the ozonation system. The water flow was then split and feed to the appropriate carbon systems. FIGURE 3 Schematic of GAC pilot system
The carbon contactors were fabricated from 12-ft-long polyvinyl chloride (PVC) pipe with and ID of 0.6 in. Previous testing had indicated that there was no measurable leaching of TOC or DBP precursors from the PVC. The contactors stood on end and were held upright by scaffolding. The GAC rested on a plate fixed approximately 1 ft above the bottom of the column. A filter nozzle, supported by gravel, was securely attached to the plate. Sample ports were installed at the influent and effluent ends of each contactor. To compare the performance of the two carbon types, the contactors were operated at a surface loading rate of 3.4 gpm/sq ft with a design empty bed contact time (EBCT) of about 14 min. The EBCT was based on previous testing of a similar water, which indicated little increase in performance at EBCTs >9 min.5 The design EBCT was increased slightly >9 min to 14 min to assure good performance. In the authors' opinion, minor differences in EBCT (13 min for GAC A and 14 min for GAC B) were not significant. Water flow was measured by in-line flow meters, à and the total flow passing the contactors was monitored by totalizers. ¤ As illustrated in Figure 3, the GAC A contactor was operated in an up-flow mode, and the GAC B contactor was in a down-flow mode. An air-and-water backwashing system was installed in each unit to facilitate cleaning of the carbon. The freeboard in each unit was approximately 5 ft high to minimize loss of carbon during backwashing. The freeboard section of the GAC B contactor was made of clear acrylic. Because the GAC B carbon was less dense than the GAC A carbon, there was concern that the former might be lost during backwashing. The clear top allowed the operator to see the expansion of the carbon bed and to prevent carbon losses during backwashing. The characteristics of the carbon bed, loading rates, and EBCTs of each contactor are summarized in Table 1. TABLE 1 Pilot-plant design
________ *CH2M HILL, Reston, Va. Carbon. GAC A was developed for removing dissolved organics by adsorption and has widespread use in the water treatment industry. The manufacturer claims that GAC A is produced with a high internal surface area capable of adsorbing organics of both high and low molecular weight. GAC B carbon was developed to promote the attachment of bacteria. The manufacturer claims the increased housing of biomass provides the following benefits:
TABLE 2 Characteristics of GACs
To ensure that the carbon put into each contactor was generally the same size, a sample splitter was used to collect samples for sieve analysis. The sieve analysis showed that GAC B carbon is physically similar to GAC A in terms of distribution of particle sizes (Figure 4). The effective sizes were 0.92 and 0.88 mm for GAC B and GAC A, respectively, and they both had a uniformity coefficient near 1.8 (1.80 for GAC B and 1.75 for GAC A). This consistency between the GACs was not surprising because for the pilot study, the manufacturer of GAC B sized the GAC to match the specifications of GAC A. FIGURE 4 Sieve analysis for GACS
Ozone system. The ozone system (Figure 5) consisted of three 4-in.-diameter, 12-ft-long PVC contactors plumbed in series. The contactors were counter-current; ozone was introduced to the bottom of the contactors through a bubble diffuser, and settled water was introduced at the top. Ozone was produced by an ozone generator* using air to achieve an ozone concentration of 1-2 percent by weight, as measured by an ozone monitor. All tubing and fittings for transferring ozone gas were ozone-resistant and were composed mainly to PTFE and stainless steel. FIGURE 5 Schematic of ozonation system
The ozone-go-TOC ratio may be an important parameter for the biological degradation of organic matter. However, investigation into the effects of different ratios was not an objective of this research. For side-by-side comparisons of the two GACs, the ozone-to-TOC ratio was fixed. During normal operation, water was introduced to the contractors at a flow of 4 gpm, and ozone was fed to attain a total transferred dose of approximately 3.0 mg/L. With an average TOC concentration of 3.85 mg/L in the settled water, the ozone dose was approximately 0.78 mg ozone/mg TOC. This value is consistent with previous research that suggested an ozone-to-TOC ratio range of 0.5-1.0 mg ozone: mg TOC for enhancement of biodegradation.3 The third contactor and the clear-well acted as contact chambers, allowing the ozone to react and dissolved gases to dissipate. Measurements of aqueous ozone were determined from colorimetric tests à taken at four sample ports (Figure 5). _____________________ Operational procedures The contactors were backwashed using air scour followed by water up-wash at approximately 30 percent bed expansion. The frequency of contactor backwash was every one to two weeks or when 7 ft of head loss developed. Samples were collected Monday through Friday, usually in the morning. Sampling locations included the influent and effluent of the ozone and GAC contactors (Figure 3). Parameters measured in the sampling schedule included TOC, temperature, dissolved oxygen (DO), chlorine demand, and potential for formation of total organic halides (TOX), chloroacetic acid (CAA), and trihalomethanes (THMs). The pilot study lasted from April 1991 until April 1992. At the time of the study, there was no clear guidance from the US Environmental Protection Agency (USEPA) on which, if any, of the haloacetic acids would be regulated. Previous testing of the feed water indicated trichloroacetic acid (TCAA) and dichloroacetic acid (DCAA) comprised approximately 90 percent of the seven-day CAA formation potential. Therefore, in this study only DCAA and TCAA compounds were measured. The ozone system was operated continuously to provide a transferred ozone dose of 3 mg/L. Generally, the transferred ozone dosage was calculated once a week, when any necessary adjustments to the dosage were made. The concentration of aqueous ozone in the GAC contactor feed was also monitored and never exceeded 1 mg/L. Analyses. Total organic carbon. Samples for TOC analysis were collected in amber glass bottles, capped with PTFE-lined cups, and acidified with concentrated phosphoric acid to a pH of <2. Samples were either analyzed immediately or refrigerated at 4oC. The storage time was minimized to less than one week for refrigerated samples. Each sample's TOC concentration was determined with a TOC analyzer* that incorporated persulfate oxidation catalyzed by ultraviolet (UV) light. Early on, TOC and DOC measurements indicated that the particulate fraction of the TOC was negligible in the GAC-treated water. Chlorine demand. Chlorine-demand samples were collected in1-L glass bottles. Aqueous chlorine measurements were performed using the DPD ferrous titrimetric method.6 Chlorine stock solution was added to the sample, and chlorine concentration was immediately measured. This value was considered the chlorine dosage. After two days, the residual chlorine concentration was measured, and the chlorine demand was determined from the difference of chlorine dosage and residual chlorine. THM and TOX formation potential. Determinations of THM and TOX formation potential (THMFP and TOXFP, respectively) required the water be chlorinated with a 5-mg/L chlorine dose at pH 7. A chlorine dose of 5mg/L assured that a chlorine residual was maintained after seven days. The average chlorine residual after seven days was 2.4 mg/L and ranged from 2.2 to 2.7 mg/L. After incubation in the dark fro seven days at 22 - 26oC, the THM or TOX concentration in the water was measured. If it was not possible to perform the determinations on the seventy day, the chlorination reaction was quenched by the addition of sodium thiosulfate (Na2S2O3). The samples were refrigerated at about 4oC until the determinations could be performed. THM determinations were performed using standard method 6230C6 with purge-and-trap and gas chromatography. TOX determinations were performed by standard method 5320A.6 CAA formation potential (CAAFP). The incubation conditions for CAAFP were the same as those described for THMFP and TOXFPs. Chlorine was quenched using ammonia chloride, and analysis was performed using USEPA method 552. DO. Samples were analyzed for DO by a membrane electrode procedure using and oxygen-sensitive membrane and meter. à ________ Results
and discussion GAC
manufactured for adsorption removed seven times more total organic
Effect of ozone. Figure 6 shows that the TOC concentration in the ozonated water fed to the GAC contactors varied from 2.6 to 4.6 mg/L during the pilot study. The TOC concentration in the ozonated water averaged 3.46 mg/L, which was 10 percent less than the TOC concentration before ozonation (3.85 mg/L). The mechanism for this removal could be either chemical or biological oxidation. FIGURE 6 TOC values for the ozonated water influent
Breakthrough curves. Breakthrough profiles are most commonly used to evaluate the performance of GAC in removing target compounds. The profiles that follow are those that best represent experimental data. This best-fit profile was developed using the following equation: Ce/Co = a(1 - e-bx) + c (1) This equation represents the breakthrough curve data through an exponential rise to a maximum level. The independent variable x is the number of bed volumes fed, while the dependent variable Ce/Co is the removal efficiency. At the beginning of the analysis, the exponential term (e-bx) is ~ 1. Consequently, Ce/Co is equal to c, which represents the nonadsorbable fraction in Figure 1. For the purposes of this article, the nonadsorbable fraction is considered to be that not removed by a fresh GAC bed. For GAC A, the nonadsorbable fraction was confirmed by isotherm testing. Near the end of the breakthrough curve (when the number of bed volumes is large), the exponential term is nearly 0. At this point, the removal efficiency is constant for increasing bed volumes fed and is equal to (a + c). The biodegradable fraction is the difference between 1.0 and (a + c). The variable b is a fitting parameter that defines the shape of the exponential rise. This equation is a standard exponential rise to a maximum and has no mechanistic components. The equation was used merely to provide a smooth curve through the data and a justification for quantifying the nonadsorbable and biodegradable fractions. The approach taken in this article to use Eq 1 is a crude estimate and has inherent limitations. Differentiating adsorption and bio-stabilization near the beginning of the breakthrough curve is difficult, and the model assumes biodegradation is constant throughout the study from the test's onset. Bio-regeneration was not considered in the modeling approach. Other researchers have used more sophisticated models with multiple variables, e.g., TOC, DO. However, in this research Eq 1 was used for a relative comparison of GAC performance.
TOC. The TOC breakthrough curves for GAC A and GAC B are presented in Figures 7 and 8. Each TOC breakthrough curve has three important features. First, the amount of nonadsorbable organic material is equivalent to the ordinate intercept. At the onset of the study period, only nonadsorbable compounds were present in the effluent. For GAC A and GAC B, the nonadsorbable fractions were approximately 0.10 and 0.45, respectively. A similar nonadsorbable fraction (0.08 to 0.15) was determined for the GAC A carbon using isotherm adsorption data (Figure 9). FIGURE 9 TOC isotherm data using ground, sieved (250 x 400 screen) GAC A
The second significant features of each breakthrough curve is the fraction removed under plateau conditions. This value is assumed to be representative of removal by biological activity. At the onset of the pilot study, biological organisms underwent an initial acclimation period. However, over the time frame of the study (12 months), the acclimation period was considered negligible. The onset of biological oxidation reactions for activated columns has been reported to occur within five to 20 days.7 When the plateau is reached, few organics are removed by adsorption, and most of the TOC removal is by biological degradation. At plateau, TOC removal efficiencies for GAC A and GAC B appear to be similar. A rigorous comparison of removal at plateau is difficult because GAC A did not quite reach a true plateau and values were estimated using model projections. Using Eq 1, the breakthrough profiles were predicted to converge to 16 percent removal (Ce/Co ratio of 0.84) for GAC A and 19 percent removal (Ce/Co ratio of 0.81) for GAC B. Based on previous experience and the results of others, 3 the authors feel confident that GAC A was close to reaching a plateau and the removal efficiencies would have remained similar had the contactor containing GAC A continued to operate. The third significant feature of TOC breakthrough curves is the number of bed volumes (BV) passed to achieve plateau. This value is representative of the adsorptive capacity of the GAC and was determined by using Eq 1. For GAC B, about 10,000 BV were required to achieve plateau. However, with GAC A, Eq 1 predicted that some adsorptive capacity was available to more than 50,000 BV. This capacity was minimal because Eq1 predicted a plateau value corresponding to 16 percent removal, and at the end of the test period, GAC A was removing 18 percent of the TOC. Generally, under the conditions of the pilot study, GAC A operated in a combined adsorption-biodegradation mode, whereas GAC B functioned in a biological degradation mode. The breakthrough profiles in Figures 7 and 8 illustrate removal efficiency as a function of bed volumes passed. For purposes of comparison, the breakthrough curves are presented in Figure 10 with a temporal scale. FIGURE 10 Daily TOC removal by GAC A and GAC B
Quantity adsorbed versus quantity removed biologically was estimated using the breakthrough curves. Eq 1 was integrated between the limits corresponding to the operational period (0 to 35,550 BV for GAC B and 0 to 40,170 BV for GAC A). The resulting values (area under the breakthrough curves) represented the amount of TOC that passed the contractors. The mass of TOC that passed the contactors was then subtracted from the total mass of TOC that had been applied to the contactors throughout the study period to determine the mass of TOC removed over the course of the study. The amount that was removed by biological activity was determined from the plateau value (the sum of coefficients a and c in Eq 1). This quantity was used to calculate the mass of TOC removed biologically. Assuming that GAC A removed 16 percent of the TOC by biological activity, 1.76 kg of TOC would have been removed by biological activity during the period of operation. Using a similar analysis, GAC B removed 19 percent of the influent TOC at plateau, corresponding to 2.10 kg. It was assumed that the remainder of the TOC that was removed was removed by adsorption. Based on this crude method, GAC A adsorbed 2.24 kg of TOC, and GAC B adsorbed 0.33 kg of TOC. These results are summarized in Table 3. TABLE
3 Removal of TOC by adsorption and
Of the TOC removed on GAC A, approximately 44 percent was removed by biological activity, and of the TOC removed by GAC B > 86 percent was removed by biological activity. When expressed as function of the mass of carbon in the contactors, 56 g TOC/kg GAC was adsorbed on GAC A, and 18 g TOC/kg GAC was adsorbed on GAC B. Even though GAC B has a greater surface area per unit mass (Table 2), it has less capacity for organic materials. GAC B has 42 percent less suface area per unit volume than GAC A, but the mass of TOC adsorbed per mass of GAC is 67 percent less than GAC A. Chlorine demand. Breakthrough profiles were also constructed for chlorine demand. This parameter is significant because it
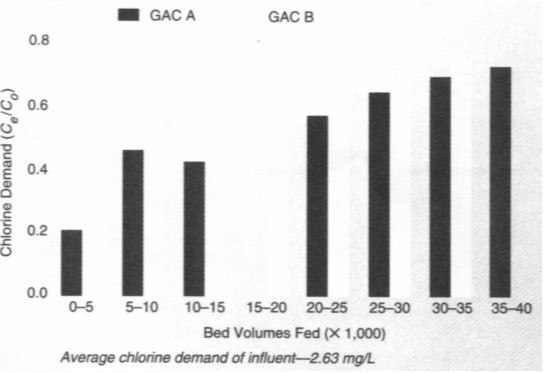
The chlorine-demand histograms for GAC A and GAC B are presented in Figure 11. Chlorine demand was not analyzed initially, and the nonadsorbable fraction was not determined. The GAC B profile appears to plateau almost immediately at a Ce/Co ratio of ~ 0.7, resulting in a removal efficiency near 30 percent. The chlorine-demand data for GAC A gradually increased and did not plateau during the pilot study. The GAC A removal efficiency continued to decline to ~ 15 percent at the close of the study. FIGURE 11 Breakthrough of chlorine demand for GAC A and GAC B
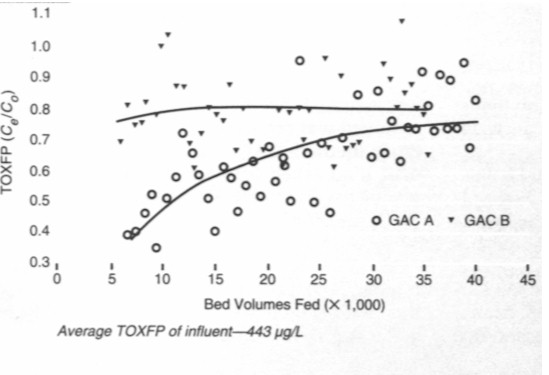
TOX. Breakthrough profiles produced for TOXFP, and important surrogate that encompasses chlorinated organics including THM and CAA components, are shown in Figure 12. Breakthrough characteristics are similar for TOXFP and TOC (Figures 7 and 8). Because of analytical complications, data were not available for TOXFP values < 5,000 BV; thus, the nonadsorbable fraction cannot be determined from Figure 12. As in the TOC and chlorine-demand breakthrough profiles, the GAC B TOXFP curve appears to reach a plateau at nearly 10,000-15,000 BV. Conversely, the GAC A TOXFP did not reach a plateau during the TOXFP sampling. By extrapolating the GAC A TOXFP breakthrough curve, removal efficiency at plateau (20 percent) is similar to that of GAC B (19 percent). The TOXFP breakthrough profiles are similar to TOC breakthrough curves for both GAC B and GAC A. FIGURE 12 TOXFP breakthrough for GAC A and GAC B
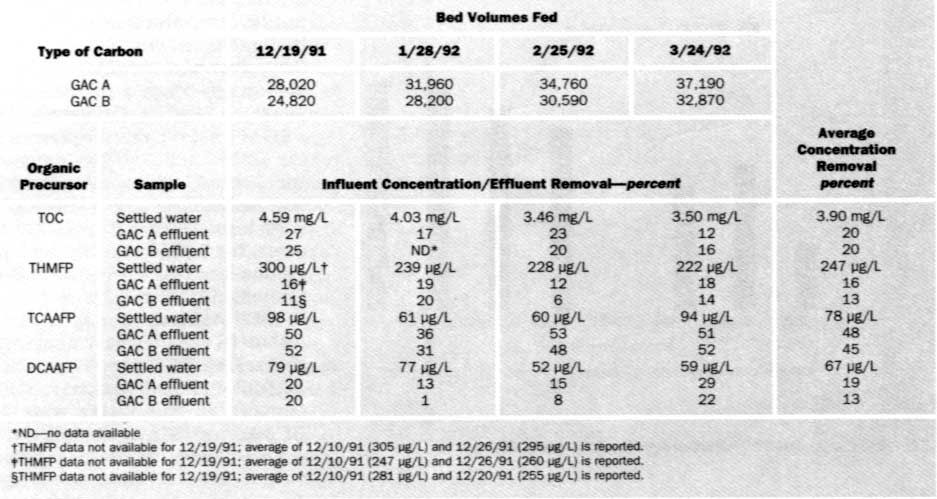
DBP control. Biological activated carbon (BAC) may have applications in controlling DBPs. An initial screening for DBPs indicated that those of primary concern in this water were THMs, DCAA, and TCAA. Samples of water were collected before and after treatment by the two carbon types four times during the pilot study and were analyzed for TOC and formation potentials (Table 4). TABLE 4 Removal of organic precursors
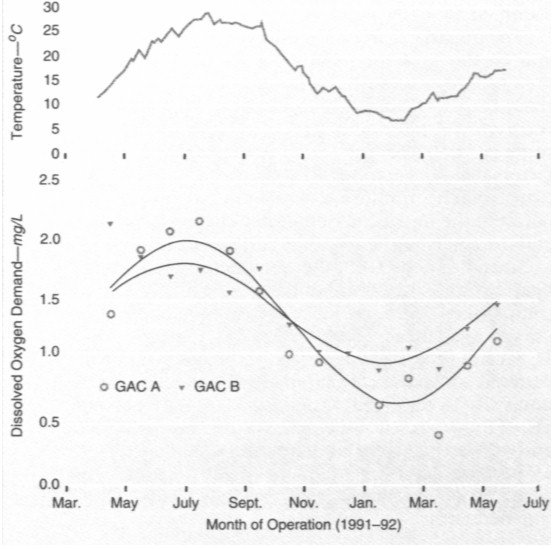
During the four sampling periods, the TOC in the feed water averaged 3.9 mg/L, which is somewhat greater than the overall average experienced over the course of the study (3.46 mg/L). It is likely the higher average was a result of poor coagulation in cold conditions that occur during the winter. The average feed water THMFP, DCAA formation potential (DCAAFP), and TCAA formation potential (TCAAFP) concentrations were 247, 78, and 67 µg/L, respectively. Because the ozonated water was not sampled, it is not possible to determine the effect of ozone alone on decreases in formation potential. Thus, the changes in water quality presented may result from either ozonation or biological activity, or both. BAC treatment reduced the concentrations of all by-products tested; however, TOC removal (20 percent for GAC A and GAC B) was not always a good predictor of by-product removal. The percentage reductions of THMs (16 percent for GAC A and 13 percent for GAC B) were similar to the percentage reductions in TOC. However, for TCAA, TOC was a poor indicator of percentage removal. TCAAFP removals averaged near 45 percent and were greater than those observed for TOC. Performance differed little between the two carbon types. A strict comparison is not valid, however, because GAC A still had some adsorption capacity left during the sampling and GAC B has been exhausted. Thus, the mechanism for removal of the precursors may not have been consistent between the two carbon types. GAC A was likely removing the precursors by a combination of biological activity and adsorption, and GAC B was removing precursors by biological activity only. In addition to the parameters listed in Table 4, formaldehyde and bromate were monitored in the influent and treated waters throughout the study. All values were below detection limits. Temperature dependence. Biological activity on GAC has been reported as temperature-dependent.8 Glaze et al observed that biological activity, as measured by carbon dioxide production on GAC contactors, decreased with decreasing temperatures.9 At 25-30oC, biological activity was near its maximum, and at 10oC, biological activity decreased sharply. TOC. Temperature was plotted parallel to TOC throughout the pilot study (Figures 7 and 8). There is no obvious correspondence between TOC removal and temperature. The TOC breakthrough profile for GAC A is well represented by the best-fit profile, and no noticeable deviations were caused by temperature fluctuations. The best-fit line for GAC B is also representative of the data. After 10,000 BV, the Ce/Co ratio is approximately constant, and the model illustrates this. In the authors' opinion small changes in biological activity were not observed because TOC measurements were too general and not specific for assimilable organic carbon. Other variables likely influenced TOC removal, confounding any temperature-related biological mechanisms of removal. DO. DO may be a more specific measurement than TOC removal for monitoring biological activity and may be used as a surrogate for biological degradation of organic material. 10 DO is consumed by aerobic microorganisms when they assimilate organic carbon. A plot of the monthly average DO demand throughout the study period is shown in Figure 13. For each GAC, peak biological activity (represented by greatest DO demand) occurs in early summer, and degradation is minimized during the winter months (December through February). A sinusoidal response is expected for DO demand because biological activity is temperature-dependent, and temperature varies throughout the year in a sinusoidal manner. Increases in DO consumption with temperature, as shown in Figure 13, are consistent with the results of previous research.8,9 DO demand with GAC A is more temperature-dependent than with GAC B. The range of DO demand during the study for GAC A is ~0.7 - 2.0 mg/L, opposed to a range of 1.0-1.8 mg/L for GAC B. On the basis of DO demand, more biological degradation occurs with GAC B during the winter months and with GAC A in the summer months. FIGURE 13 Effect of temperature on dissolved oxygen consumption
Summary The comparison of GAC A and GAC B focused on the adsorptive and biological characteristics of each carbon. With regard to biological removal, the two carbons appeared to be similar, each removing 16-19 percent of TOC. With regard to adsorption, GAC A provided more precursor removal capacity than GAC B. Biological activity as measured by DO demand appeared to be less affected by temperature in GAC B. Temperature changes did not appear to affect TOC removal. It is likely that variables other than temperature had a greater impact on TOC removal. Adsorptive capacity is evident on TOC breakthrough profiles (Figures 7 and 8). Considerably more water is treated with GAC A than GAC B to reach almost the same effluent-to-influent ratio. GAC A adsorbed about 56 kg TOC/kg GAC, and GAC B adsorbed 18 g TOC/kg GAC. The nonadsorbable TOC fraction for GAC B (0.45) was greater than that for GAC A (0.10). The surface area for GAC A per unit volume is nearly 1.7 times that of GAC B (Table 2). The difference in adsorption removal efficiency between GAC A and GAC B may result partially from the surface area imbalance. Other factors that may account for the difference in adsorption capacity include the strength of attraction between the organic materials and the available sites and the ability of the potential sorbates to reach sites. In addition to TOC, other parameters were investigated during the course of the study for the relative comparison of the GACs. The removal of organic precursors was measured by TOX. THM, DCAA, and TCAA formations. A surrogate parameter - chlorine demand - was also measured. Under plateau conditions, GAC A removed 20 percent TOXFP, 16 percent THMFP, 19 percent DCAAFP, 45 percent TCAAFP, and 15 percent chlorine demand. GAC B removed 19 percent TOXFP, 13 percent THMFP, 13 percent DCAAFP, 45 percent TCAAFP, and 15 percent chlorine demand. GAC B removed 19 percent TOXFP, 13 percent RHMDP, 13 percent DCAAFP, 45 percent TCAAFP, and 30 percent chlorine demand. Conclusion GAC can be used for DBP control. When the GAC is regenerated and operated in the adsorptive mode, large amounts of precursors can be removed. The exact removal efficiency depends on the carbon type and the regeneration frequency. GAC A removed up to 90 percent of the precursor material but would need frequent regeneration to maintain 90 percent removal. GAC B was not manufactured for maximum adsorption capability and only removed 50 to 60 percent of the precursor material with a reasonable contact time. If carbon is not regenerated or replaced, its adsorptive capacity becomes exhausted and the primary mechanism of removal appears to be biological oxidation. When the carbon is operated in a biological mode, smaller amounts of precursors are removed. In the water studied, ozone-GAC treatment removed 15-20 percent of the precursor material after the adsorptive capacity of the carbons had been largely exhausted, with the exception of TCAA. Each GAC was capable of nearly 45 percent reduction in TCAAFP. The carbon type did not appear to make a significant difference in the removal of DBP precursors. Differences in GAC type may have resulted in significant differences in the removal of other types of organic compounds that were not monitored, such as taste- and odor-causing compounds and ozone by-products. For the control of DBPs at Norfolk, GAC A is more flexible than GAC B. If required, large concentrations of DBP precursors can be removed by using GAC A as an adsorbent. If smaller reductions in DBP precursors are needed. then GAC A can be used as a biological medium. GAC A is indicated when flexibility is required, and GAC B is suitable for applications when biodegradation will suffice and adsorption is not required. References
About the authors:
Kevin M.Heffernan is a project engineer with CH2M HILL in Herndon. Craig C.Ziesemer is assistant director of the City of Norfolk Department of Utilities, 6040 Waterworks Rd., Norfolk, VA 23502. Edwin G.Snyder is senior environmental engineer at CH2M HILL, 11818 Rock Landing Dr., Suite 200, Newport News, VA 23606. Reprinted and copyrighted as
part of |