![]()
CALGON CARBON CORPORATION
|
|
|
|
Industrial Wastewater |
Carbon with a Twist By Steve Butterworth, Carl Adams, Ron Falco and Al Pedigo Granular Activated Carbon Reduces Toxicity at Chemical Manufacturing Facility Granular activated carbon (GAC) recently proved to be the technology of choice for a U.S. organic chemical manufacturer seeking to reduce its effluent toxicity. The technology was evaluated during pilot-scale tests and consistently produced an effluent below the NPDES permit maximum of 2.5 toxicity units (TUs). The facility's wastewater treatment plant uses equalization, pH adjustment, activated sludge and clarification to treat 1,500 gallons per minute (gpm) of wastewater. Toxicity screening indicated effluent from the plant exceeded anticipated permit limits. Under the permit, toxicity had to be determined by the more sensitive of either Pimephales promelas (fathead minnows) or Daphnia pulex organism, using a 48-hour static test regime. The first step in determining the optimal approach for eliminating toxicity was an evaluation of individual production stream wastewaters. Results revealed that all stream were toxic and that no benefit would be gained by isolating and treating individual sources. Several pretreatment technologies - pH adjustment, flocculation and settling of solids, peroxide oxidation, air stripping, solvent extraction and GAC adsorption - were evaluated and rejected as ineffective or impractical. Bench-scale treatability tests were then conducted to determine whether alternative biological treatment schemes would effectively reduce whole effluent toxicity. Tests involved:
These modifications provided only marginal improvement, and their performance degraded significantly when challenged with the types of organic shockloads expected at the treatment plant. The final treatment technique tested was the application of activated carbon adsorption to whole effluent from the treatment plant. Incompatibility with the existing aeration equipment ruled out the use of powdered activated carbon, but GAC displayed an affinity for toxic constituents in the effluent - primarily organics - by reducing toxicity to 1.8 TUs. The adsorption capacity of the GAC used in these tests was 0.25 grams of total organic carbon (TOC) adsorbed per gram of carbon. These findings were promising enough to prompt a pilot-scale program and the design of a study that would provide operating data and allow the development of carbon use rates for a full-scale project.
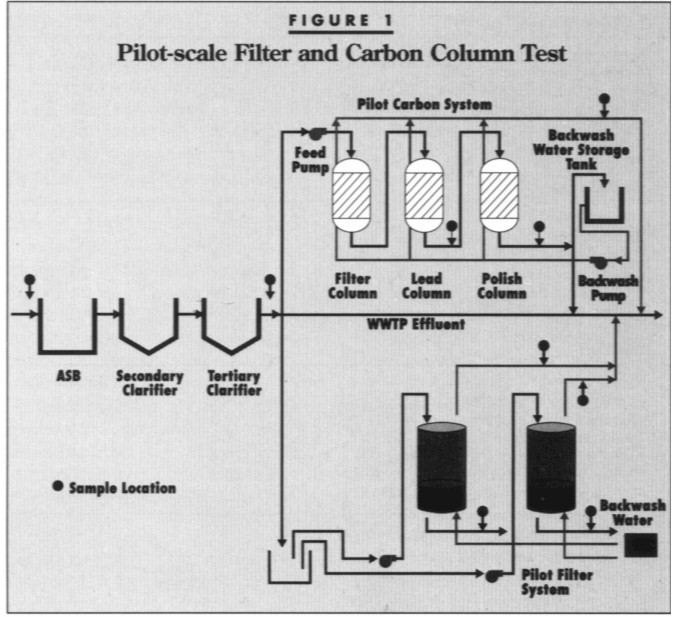
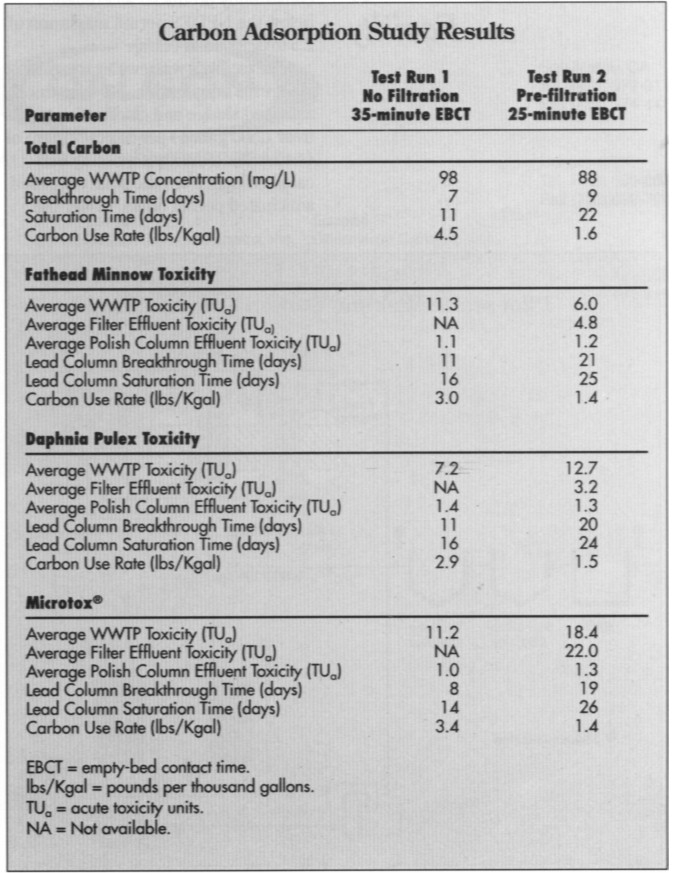
Pilot study. The pilot-scale GAC system consisted of two adsorbers arranged in a series. Each was 4 feet in diameter and 5.5 feet deep (Figure 1). The hydraulic loading rate was 2.4 gpm per square foot during the first test run and 3.2 gpm per square foot during the second test run. These rates corresponded to empty-be contact times of 35 minutes and 25 minutes, respectively. (Two times were used to define the impact of flow rate on the width of the toxicity mass transfer zone). During the test program, 24-hour effluent composites from the treatment plant and pilot system were collected, and the lead column and filter units were backwashed when their head loss reached 30 pounds per square inch. The innovative approach developed for this study involved using toxicity rather than such conventional parameters as total carbon or TOC as the "constituent of concern" for determining GAC breakthrough and saturation and the need for GAC changeout. Toxicity monitoring was performed using three species: fathead minnows, Daphnia pulex and Microtox¨ , a system developed by Microbics Corp. (Carlsbad, Calif.). The Microtox¨ test was used because it requires less than one hour to complete, while static toxicity tests take 48 hours. The test works by comparing the light output from bioluminescent bacteria in contact with the water to a control (reagent blank). Microtox¨ EC50 values - the concentration at which a 50 percent reduction in light emission occurs - were converted to TUs for cross-species comparison by dividing the EC50 into 100. An inherent assumption was that Microtox¨ values were equivalent to TU values. If Microtox¨ showed a reasonable correlation with fathead minnow and Daphnia pulex results, it would be a convenient, real-time technique for monitoring a full-scale GAC system for toxicity breakthrough and saturation. Column changeout during the pilot study was predicated on toxicity breakthrough and saturation for either fathead minnows or Daphnia pulex, whichever occurred first. At saturation, the lead carbon column was taken out of service, reloaded with fresh carbon an placed in the polish position. The former polish column then became the lead column. A test run was considered complete when the former polish column - now in the lead position - became saturated. Fathead minnow and Daphnia pulex tests were performed frequently to provide a rigorous measure of toxicity for comparison to Microtox¨ results. Conventional chemical parameters also were measured, although all decisions concerning the pilot study were based on toxicity. Results. Test conditions and results for both runs are presented in the table below. Average influent conditions were calculated for the entire duration of both runs, which each included one column changeout. The breakthrough values and saturation times are averages for the two lead columns for each test run. The saturation time in each test run was converted to a carbon use rate (pounds of carbon per thousand gallons of treated effluent).
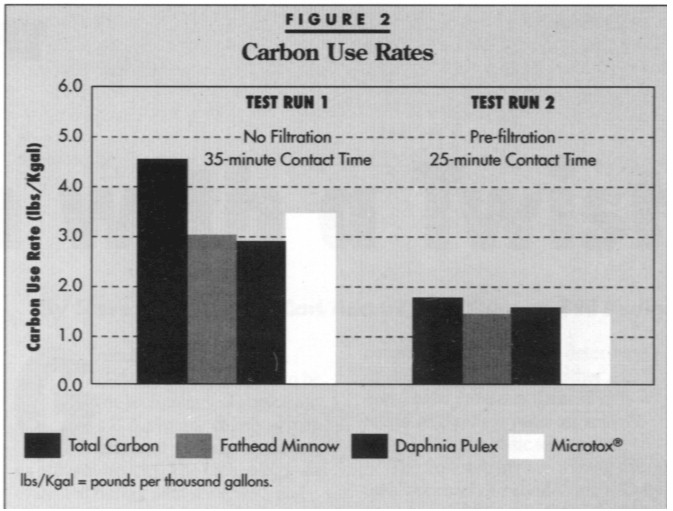
Figure 2 presents carbon use rates calculated on the basis of total carbon and toxicity parameters. For the first test run, carbon use was 3.0, 2.9 and 3.4 pounds per thousand gallons based on fathead minnow, Daphnia pulex and Microtox¨, respectively. The use rate, based on total carbon saturation, was 4.5 pounds per thousand gallons. Use rates for the second test run were 1.4, 1.5 and 1.4 pounds per thousand gallons for fathead minnow, Daphnia pulex and Microtox¨, respectively. The total carbon saturation use rate - 1.6 pounds per thousand gallons - again was greater than the toxicity-based use rates. This demonstrates that lower carbon use rates can be achieved in this system by monitoring toxicity rather than total carbon. Because use rate is proportional to operating costs, lower use rates would translated to lowering operating costs in a full-scale system. During the second test run, existing plant toxicities for fathead minnows, Daphnia pulex and Microtox¨ were 6.0, 12.7 and 18.4 TUs, respectively. A pilot-scale granular media filter used during the second test run reduced toxicities for fathead minnows and Daphnia pulex to 4.8 and 3.2 TUs, respectively. The Microtox¨ toxicity following filtration was 22.0 TUs. The average polish column effluent toxicity during the second test run was 1.2 for fathead minnows, 1.3 for Daphnia pulex and 1.3 for Microtox¨. Although organics were causing effluent toxicity, specific chemicals and global parameters monitored during the study, such as total carbon, TOC and BOD, did not correlate directly with toxicity results. Saturation of the GAC bed occurred for all organic parameters before toxicity saturation occurred. Meanwhile, an inorganic parameter - total dissolved solids (TDS), as measured by conductivity - was found to correlate with specific intervals of exceptionally high toxicity. TDS, or salinity, refers to a group of common cations and anions that can cause toxicity in wastewater, particularly where freshwater test organisms are concerned. Because treatment plant effluent was highly variable, TDS was suspected as a cause of effluent toxicity. This is significant, because GAC has a negligible capacity for adsorbing dissolved salts. The treatment plant, therefore, probably would have to request a mixing zone in its new permit to mitigate the salt impact. A quantitative assessment of TDS was desired to establish a basis for requesting a mixing zone, so a series of salt spike tests were performed to determine the level of salinity that would cause 50 percent mortality. Test results showed that the LC50 for TDS using Daphnia pulex and fathead minnows occurred at concentrations of 3,300 milligrams per liter and 8,300 milligrams per liter, respectively. The Daphnia pulex organisms regularly exhibited toxic effects from the salinity, while the fathead minnows were only affected at the beginning of the second test run.
Sizing up. The use rate during the pilot-scale study was low for a wastewater treatment application. Results demonstrated that, even at the highest flows tested, the toxicity mass transfer zone was contained by one GAC vessel. This means GAC in the lead vessel could be used until complete saturation without compromising effluent quality. It also means a full-scale system would be fairly flexible in terms of timing GAC changeout or handling temporary increases in flow rate. The proposed full-scale system, including pre-filtration, is designed at a 30-minute empty-bed contact time. This design will accommodate planned increases in wastewater flow from 1,500 gpm to 2,000 gpm, with only a minor addition of equipment. The projected GAC cost associated with a full-scale system is 75 cents to $1.50 per thousand gallons treated. To alleviate potential problems associated with highly fluctuating TDS levels, the facility was advised to seek approval for a diffuser to enhance the dispersion of TDS in its effluent. Although Microtox¨ was not a useful parameter for predicting the exact toxicity values for Daphnia Pulex and fathead minnows, it was useful for estimating breakthrough times for the carbon columns. It quickly verified that no toxicity was escaping from an individual carbon column after changeout and startup. It also provided a conservative indication of when a GAC column required changeout. It was determined, therefore, that the Microtox¨ test could be used as simple, rapid method for monitoring a full-scale system at this facility.
Steve Butterworth is a research chemist at Calgon Carbon Corp. (Pittsburgh). Carl Adams is president of The Advent Group (Brentwood, Tenn.). Ron Falco is a branch manager, and Al Pedigo is a project engineer at The Advent Group.
Reprinted from INDUSTRIAL
WASTEWATER Magazine, Volume 2, Number 2, March/April 1994 |