Preferential Flow of Liquid
Manure to Subsurface Drains
Larry D. Geohring
Sr. Extension Associate, Cornell Cooperative Extension
Peter E. Wright
Sr. Extension Associate, Cornell Cooperative Extension
Tammo S. Steenhuis
Professor, Cornell University
Introduction
The USGS National Water Quality Assessment data for the Northeast
indicate animal manure was the primary source of nitrogen (N) and phosphorus (P) inputs to
the watersheds (about 41 lbs/acre). Manure source inputs of N exceeded fertilizer,
atmospheric and other point sources of these nutrients. Manure N accounted for 36% of the
total N inputs, slightly higher than the N inputs from the atmosphere, the next highest
source. The fate and transport mechanisms of nutrients from manures is complex and still
not well understood.
Much attention has been focused on water quality contamination from
rapid surface runoff of manured areas (Brockamp, 1993). However, information on the water
quality from tile beneath manured sites, and especially the portion attributable to
preferential flow, is inadequate. A better understanding of these processes would be
beneficial to improving manure application management decisions about timing, amount, and
application method which maxirnize the nutrient benefits of manure while minimizing the
contamination of receiving water bodies.
Preferential transport processes can move significant quantities of
contaminants very rapidly, with little alteration, to the shallow groundwater and then to
tiles. A significant portion of cropland where manures are applied has also undergone
various tile drainage improvements. In these areas, preferential flow contributes to the
tile discharge which is outletted to surface waters. Experimental efforts with
preferential transport have not been adapted specifically to manure to assess whether
manure will also be rapidly transported.
Evans and Owens (1972) and Dean and Foran (1992) reported the
application of liquid manures to tile drained fields resulted in elevated levels of
nutrients and bacteria compared to normal tile discharges from unmanured sites. Fleming
and Bradshaw (1992) reported maximum levels of 88.2 mg/l of NH4-N, and 1020 mg/l total
suspended solids; and McLellan et al. (1993) reported peak concentrations of 53,000
organisms/100 nil of E. Coli in tile discharges shortly after application of liquid
manures which originally contained 149 mg/l NH4-N and 7,000,000 organisms/100 tnl of E.
Coli. For comparison, the accepted maximum effluent standard for most municipal
wastewater treatment plants is 400 organisms/100 rnl of E. Coli and 37 mg/l of
total suspended solids.
Bacteria typically ranges in size from 0.3 to 12 um and protozoans such
as Cryptosporidium parvum and Giardia @lia are approximately 2-5 um and 5-10 um
respectively. Thus, these limited observations of the occurrence of bacteria in the drain
effluent may also be an indicator that these protozoa are also present. Consequently, it
appears that preferential flow processes can have important implications on the fate and
rapid transport of nutrients and pathogens from the applications of manures. These
observations indicate that transport of liquid manure contaminants may lead to high and
undesirable concentrations of nutrients and bacterial pathogens to subsurface drains and
subsequently into receiving water bodies.
Methods and Materials
A field experiment was initiated at Cornell University's Willsboro
Farm located in Northern New York and adjacent to Lake Champlain. The experimental plot
area consists of 8 tile drained plots where each plot consists of a single drain line
discharging into a manhole. The soil in the plots is a somewhat poorly drained Rhinebeck
variant fine sandy loam which has similar drainage characteristics to 880,000 acres of
somewhat poorly drained soils commonly used for agriculture in NY. No manure was
previously applied to these plots for the last 16 years.
After the harvest of corn silage and prior to any manure application
four plots were pre-wetted with sprinkler irrigation (Plots # 3,4,5, and 6) to establish a
soil moisture differential and until drain flow commenced. A total of 3 inches of water
was applied during the pre-wetting process.
Dairy cow manure from a manure storage pond was applied with a bulk
tank spreader at a rate -of 5000 gal/acre across all 8 plots. The manure contained 6.7%
solids. The nutrient content of this manure was 0.22% Nitrogen of which 0.09% was
AmmoniaN. The manure application rate was typical of what farmers in the area would
normally spread and was selected to meet part of the nitrogen needs of the next years corn
crop.
Irrigation at a rate of 0.5 in/hr was initiated on Plots 1, 2, 3, and 4
within hours of manure application and before the manure had dried on the surface. The
remaining four plots (Plots 5, 6, 7, and 8) were irrigated I week later, after the manure
had an opportunity to dry on the surface. During and following irrigation, the drain
discharge was measured and sampled using a grab sampling technique at 15-minute intervals.
Irrigation was continued until all the irrigated plots exhibited drainflow.
Results
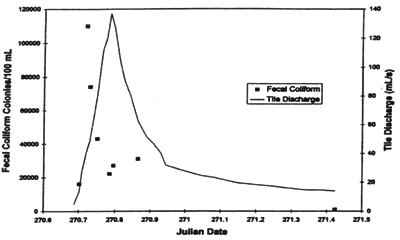
The typical response of fecal coliform concentrations being
discharged from the subsurface drain is shown in Figure I for Plot 4 which was irrigated
within hours after the liquid manure application. Plot 4 had returned to a base flow
discharge of 5 n-A/s after the pre-wetting irrigation, and this was the condition during
the application of the liquid manure. The preferential movement of fecal conform is
demonstrated in the figure where the peak concentration of fecal coliform occurred within
40 minutes after the start of irrigation and 95 minutes prior to the peak in the drain
discharge. As the drain discharge began to increase, the fecal coliform concentration
began to decline where it hovered around 25,000 to 30,000 colonies/100 ml until the
irrigation was stopped. Smaller amounts of fecal coliform continued to be discharged
during the next 24 hours as the discharge gradually approached the previous base flow
situation. The tile drainage effluent during this event exhibited the color and odor of
liquid manure, and the discoloration could be directly associated with the changes in
fecal coliform concentration.
Ammonium-Nitrogen from the liquid manure was also measured in the drain
effluent. The NH4-N in the drain discharge also exhibits preferential flow phenomena,
reaching a peak concentration during the rising limb of the drain discharge hydrograph.
Ammonium-N is generally believed to adsorb strongly to the soil, but apparently
preferential flow processes temporarily dominate this reaction. The similarities of fecal
coliform and NH4 -N preferential transport suggest that either one could be used as an
indicator of the other.
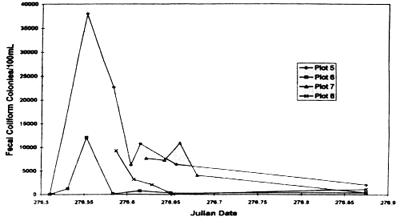
There is a similar response of fecal coliform bacteria concentrations
in the drain discharge when irrigated 6 days after the liquid manure application. There
was a natural precipitation event 2 days after the manure application, which had also
delivered a total of 0.9 inches. Figure 2 shows the response of fecal coliform
concentrations for Plots 5 & 6 which had been pre-wetted along with concentrations for
Plots 7 & 8 which had not received the pre-wetting irrigations. In Plots 7 & 8
there was no drain flow during the application of the manure or prior to the irrigation
event. For Plot 8 the peak fecal coliform concentration occurred 3.2 hours after the start
of irrigation and 60 minutes before the peak in the drain discharge. The peak
concentration for Plot 7 occurred 4 hrs. after the start of irrigation. Figures 1 and 2
show similar preferential flow responses despite the events being 6 days apart and the
manure having the opportunity to dry on the surface. The only major difference in Figs. 1
and 2 is in the peak concentration of fecal coliform, which is approximately 1/3 to 1/10
less. It is not clear whether this reduction in fecal coliform peak concentration is
attributable to the plot variability, the leaching loss from the interim rainfall event or
simply due to the 6-day delay after the manure application. Nevertheless, it is still
surprising that this high a concentration was still observed given the time, which had
elapsed since the initial manure application.
Conclusion
Liquid manure applied to the soil surface at nominal rates, and
followed by a precipitation event, can result in bacterial contamination of a subsurface
drain in soils which exhibit preferential flow characteristics. Concentrations of
nutrients and bacteria will be at peak sooner than the flow of water. The timing of the
precipitation event following the liquid manure application will influence the magnitude
of the peak concentrations of bacteria such as fecal coliforms. Liquid manure which had
dried on the surface did not eliminate the further risk of fecal coliform transport upon
rewetting within a 6 day period. An irrigation event on the same day of liquid manure
application resulted in a peak concentration of 110,000 colonies/100ml, and an irrigation
6 days after the manure application still resulted in a peak concentration of 38,000
colonies/1001W.
Given a constant precipitation rate, the initial soil moisture content
at the time of a precipitation event will influence the length of time which elapses
before preferential flow occurs. Liquid manure application to the soil surface when the
drain is flowing will result in rapid movement (within minutes) during a precipitation
event. For the case when the soil is drier and there is no drain flow, preferential
movement of fecal coliform still occurred during a precipitation event when the event was
extended for several hours. The peak concentration of fecal coliform did not appear to be
affected by the initial soil moisture content.
Surface applied manure potentially can contaminate tile lines and
subsequently the surface waters that the tile outlet to. Preventing this from occurring
could include reducing the amount of manure applied or plugging the tile lines for a
period after application. On most dairy farms in NY these options are not feasible.
Many farms produce 5,000 gal. of manure per acre of cropland. To reduce
the amount of manure spread per acre would require more land or less cows. Plugging tile
lines will not be effective on slopes exceeding 2%. The tile will either need a plug every
200 ft. or the water will come out around the plug due to head pressure.
One possible solution would be to incorporate the manure as it is
applied. By mixing it with the soil it is more likely that the NH4 will be absorbed to the
soil. Incorporation should also reduce the amount of preferential flow occuring by
breaking up some of the surface flow paths and also by reducing the amount of manure that
surface flows are in contact with.
Currently continued research is underway at the Willsboro site to try
to discover if incorporation will reduce the potential for tile line contamination.
References
Brockamp, D.W. 1993. Effluent Quality From Livestock Operations. ASAE Paper No.
93-4568. American Society of Agricultural Engineers, St. Joseph, MI.
Dean, DM. and M.E. Foran. 1992. The Effect of Farm Liquid Waste Application on Tile
Drainage. J. of Soil and Water Conservation, 47(5):368-369.
Evans, M.R. and J.D. Owens. 1972. Factors Affecting the Concentration of Faecal
Bacteriain Land Drainage Water. J. of General Microbiology, 71:477-485.
Fleming, R.J. and S.H. Bradshaw. 1992. Contamination of Subsurface Drainage Systems
During Manure Spreading. ASAE Paper No. 92-2618. Amer. Soc. of Agricultural Engineers, St.
Joseph, MI.
McLellan, J.E., R.J. Fleming and S.H. Bradshaw. 1993. Reducing Manure Output to Streams
from Subsurface Drainage Systems. ASAE Paper No. 93-2010. Amer. Soc. of Agricultural
Engineers, St. Joseph, MI.
van Es, H.M., T.S. Steenhuis, L.D. Geohring, J. Verrneulen and J. Boll. 1991. Movement
of Surface-Applied and Soil-Embodied Chem- icals to Drainage Lines in a Well Structured
Soil. In: T.J. Gish and A. Shinnohanimadi (Eds.), Preferential Flow. American Society of
Agricultural Engineers, St. Joseph, MI. pp. 59-67.
Figure 1: Fecal coliform discharge concentrations in relation to the
tile discharge hydrograph for plot 4.

Figure 2. Fecal coliform discharge concentrations with respect to time
for the pre-wetted plots (5 & 6) as compared to the dry plots (7 & 8) during the
irrigation event 6 days after the manure application.

To Top |