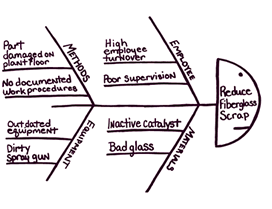
Chef’s Special: Ishikawa Fish(bone)
|
SOURCE Newsletter,
Summer, Volume 17, Number 3. Minnesota Technical Assistance
Program, University of Minnesota |
|
Is your company hungry for a strategy to help employees make
the most-informed decisions possible? If so, a decision making tool like the
Ishikawa diagram is what your company is craving. Fully understanding your
situation and evaluating the potential effects of options are key to making
successful decisions. Decision making tools can help.
 Ishikawa
Fishbone
This fish-shaped diagram helps illustrate cause-and-effect
relationships. First, employees identify a problem, shown as the head. Main
causes are brainstormed and categorized, creating the fins. Typical categories
include equipment, materials, methods, personnel and environment. Then, effects
of main causes are listed, building the small bones. Completing this diagram
helps analyze the problem and starts discussions about its root causes.
Decisions can then be made to correct the source of the problem.
House Specials
Many other tools
are available if the Ishikawa diagram doesn’t suit your company’s taste. Use
these tools alone or together to improve your decision making process.
Pareto Chart. According to the
Pareto Principle, usually 80 percent of the trouble is caused by 20 percent of
the problems. Pareto charts are bar graphs that rank identified problems by
their frequency. This allows you to prioritize and tackle your main problems
first.
Decision Tree. Each possible
decision can affect your company differently. Decision trees can help you choose
between different courses of action by identifying each decision’s effects. The
trunk of the tree represents the problem that needs solving. Possible solutions
are the tree limbs and anticipated results of solutions are branches.
A force field analysis can help your company identify the pros
and cons of a decision by looking at the forces pushing for and against it.
Decision wheels can illustrate how far-reaching the results of a single decision
are, and process flow charts and scatter diagrams are useful for studying how
various steps in your processes work together.
Additional Resources
Ishikawa
United States
Bureau of Reclamation
University of
Alberta
Pareto Principle
Purdue
University
United States
Bureau of Reclamation
Quality Assurance Project
Decision Tree
Mind Tools
Force Field
Mind Tools
Iowa State
University Extension
The Managers Electronic
Resource Center
Decision Wheels
Silos
& Smokestacks National Heritage Area
Process Flow Charts
Clemson
University Department of Industrial Engineering
Scatter Diagrams
United States
Bureau of Reclamation
 Ishikawa
Fishbone