AIR
QUALITY RESEARCH AND TECHNOLOGY TRANSFER WHITE PAPER AND RECOMMENDATIONS FOR
CONCENTRATED ANIMAL FEEDING OPERATIONS
by
Confined Livestock Air
Quality Committee of the
USDA Agricultural Air
Quality Task Force
John M. Sweeten (Chair),
Texas A&M University
Larry Erickson, Kansas State
University
Phyllis Woodford, Colorado
Department of Public Health & Environment
Calvin B. Parnell, Texas
A&M University
Kendall Thu, Northern
Illinois University
Tommy Coleman, AAMU - Plant,
Soil, and Animal Sciences
Robert Flocchini, University
of California - Davis
Clinton Reeder, Pendleton,
OR
Jerold R. Master, Arkansas
Pork Producers Association
William Hambleton, Fresno,
CA
George Bluhm,
USDA-NRCS
Dennis Tristao, J. G.
Boswell Company
Adopted
by
USDA Agricultural Air
Quality Task Force
Washington
D.C.
July 19,
2000
Acknowledgements
The
following persons also contributed written material or valuable editorial
suggestions:
·
Dr. Allen Sutton, Purdue
University
·
Dr. Brent W. Auvermann,
Texas A&M University
·
Dr. Lowell Ashbaugh,
University of California - Davis
Table of
Contents
EXECUTIVE
SUMMARY
Introduction
Air
Quality Parameters and Concerns
1. Odors and
Odorants
2. Major Gases of Concern - Ammonia
and Hydrogen Sulfide
3. Particulate Matter --
PM10 and PM2.5
4. Co-Product Gases – CO2,
CH4, etc
Emission
Factors: A Case for Accuracy
1. Significance of Emission
Factors
2. Emission Factors for Cattle
Feedyards and Dairies
3. Errors in the AP-42 Cattle Feedyard
Emission Factor
4. Comparison of Emission Factors
Using a Line Source (TAMU Process)
and ISC Dispersion Modeling
5. PM
Concentrations
6. Recommendations for Correcting
Emission Factors
Human
response and health effects
1. Confined
Animals
2. Employee
Concerns
3. Affected
Public
Current
Policy – Characterization and Assessment
1. Overview
2. Federal
Policies
3. Recent State Policy
Developments
Current
Technologies to Address Odor Problems
1. Approaches: An
Overview
2. Diet Effects on
Odors
3. Manure Treatment for Odor
Control
4. Capture and Treatment of Odorous
Gases
5. Enhanced Dispersion of
Odor
6. Summary of Odor Control
Opportunities
Candidate
Dust (PM) Control Practices
Current
Research Programs to Address Problems
1. General Characterization of Prior
Research
2. Health
Issues/Risks
3. Current Research
Levels
Research
Needs Assessment
1. PM Emission
Factors
2. Odors and
Odorants
3. Dispersion
4. Indoor Air Quality, CAFO
Buildings
5. Health
Effects
Technology
Transfer Program Needs
1. Producers and Private
Industry
2. General Public and Affected
Neighbors
3. Public
Programs
4. Technical/Engineering
Assistance
Discussion
of Recommended Program Needs
1. Prioritized
Topics
2. Partnerships
3. Budgetary Requirements &
Recommendations
4. Implementation - Initiatives,
Agency Actions, etc
SUMMARY
REFERENCES
TABLES
APPENDICES
AIR QUALITY RESEARCH AND TECHNOLOGY TRANSFER WHITE PAPER AND RECOMMENDATIONS FOR CONCENTRATED ANIMAL FEEDING OPERATIONS
Report Prepared
by:
Confined Livestock Air
Quality Subcommittee
USDA Agricultural Air
Quality Task Force (AAQTF)
EXECUTIVE SUMMARY
U.S. farmers are leaders in producing the safest and most economical food supply in the world. Each year, U.S. consumers spend less than 11% of their income on food. Concentrated animal feeding operations (CAFOs) have largely contributed to the ability of U.S. producers to meet growing demands for the production of meat, milk, poultry and eggs. To maintain a safe and economical food supply, producers must have sufficient lead-time, cost-effective technologies, and resources to adjust to changing public agendas that include air quality protection. To continue this predominance in agricultural production, the USDA Agricultural Air Quality Task Force (AAQTF) established by Congress in the 1996 Farm Bill, recommends an additional $65 million be annually appropriated for agricultural air quality issues. Of this amount, $12.8 million should be specifically targeted for CAFO research needs.
The following information summarizes the findings of the AAQTF in regard to air quality issues associated with CAFOs. A full discussion of the issues can be found in the “Air Quality Research & Technology Transfer White Paper and Recommendations for Concentrated Animal Feeding Operations”.
CAFO
Air Quality Parameters
- CAFOs can affect air
quality through emissions of odor, odorous gases (odorants), particulates
(including biological particulate matter), volatile organic compounds and/or
some of the so-called greenhouse gases.
- Odor from CAFO sources, as
experienced by humans, is the composite of as many as 170 or more specific
gases, present in trace concentrations either above or below their olfactory
thresholds.
- The primary odorous gases
of concern include ammonia and hydrogen sulfide. However, the importance of ammonia and
hydrogen sulfide to downwind composite odor as perceived by neighbors is
questionable.
- Field and laboratory
research has largely focused on measuring concentrations of odor. Data on emission rates, flux rates and
emission factors are needed to develop science-based policies for the
reduction of CAFO odor and odorants.
- Future research should be
directed toward odorous gases that more closely correlate with odor as
perceived by humans.
- Carbon dioxide, methane
and non-methane reactive organic gases are natural products of manure
decomposition. Strategies to
reduce emissions of odor and odorants are likely to reduce emissions of these
co-product gases.
Emission
Factors
- Improved processes for
updating emission factors for an array of CAFO-related air contaminants, such
as PM10, PM2.5, volatile organic compounds and ammonia
should be initiated.
Human Response and Health Effects
- Concerns with health
effects of odor, odorants, biological and other particulate matter from CAFOs include livestock,
employees and neighbors. Recent
evidence suggests greater secondary health effects on frequently exposed
neighbors than previously documented.
Current Federal and State
Policies
- Water quality concerns
were first addressed in the Federal Water Pollution Control Act of 1972, which
listed CAFOs as point sources. A
patchwork of tailored policies and regulations has attempted to address voids
of groundwater protection and nutrient management, and only in a few cases
have air quality concerns been addressed.
Integrated
Programs
- Integrated programs to
address air quality from CAFOs have not been funded or developed. A collaboration of agencies is needed
to work with issues associated with CAFOs and air quality, just as similar
collaborative activities have succeeded in regard to water
quality.
Odor Control
Technologies
- There are four basic
approaches to control odor and odorants: ration/diet manipulation, manure
treatment, capture and treatment of emitted gases and enhanced
dispersion. Each approach has
multiple technologies that need to be tailored on a site-specific
basis.
Dust Control Technologies
- Technologies for
particulate (dust) control from open-lot feeding systems, where needed,
include frequent manure removal, stocking density adjustment to take advantage
of excreted manure moisture and water sprinkling.
Research Funding
- A program of accelerated
research, education, technical training, technology transfer and financial
assistance to address CAFO air quality problems is strongly recommended.
Of the USDA-ARS FY96-99 animal waste research budget of $5.65 million per year and $6.9 million in the CSREES FY97 budget, the amounts devoted to air quality were so small as not to be separately reported.
USDA and EPA funding levels
have not been adequate to address or solve air quality problems associated with
CAFOs. The
USDA AAQTF recommends at least $12.8 million per year for coordinated,
integrated programs for animal agriculture, as part of the additional $65
million in total funding requested for agricultural air quality.
Research
and Technology Transfer Needs
Numerous research and/or
technology transfer needs and opportunities were mentioned in the text of this
report. In brief, these include:
·
Develop accurate and broadly
applicable emission rates, flux rates and emission factors for particulate
matter, odor and specific odorants applicable to CAFOs;
·
Define emission rates as a
function of diurnal, seasonal, and climatic variations, as well as design and
management practices;
·
Develop effective, practical
and economically feasible odor control technologies for confined animals,
treatment, and land application systems;
·
Determine relationships
among odor, odorants, particulates and airborne microbial
species;
·
Identify kinetic release
mechanisms for odorants and odor from principal manure sources and target the
development of control technologies accordingly;
·
Develop practical ways,
capable of widespread adoption, of reducing ammonia from CAFOs;
·
Transfer economically viable
technologies for odor control to all producers regardless if they are a
CAFO or animal feeding operation (AFO);
·
Develop innovative air
treatment processes for confinement building exhausts or covered lagoon
surfaces;
·
Develop odor reduction
treatments for use prior to land application;
·
Develop accurate
standardized measurement technologies for odor, odorants of principal concern,
and fine particulate, and ensure these systems become widely available for
research and demonstration; this should include electronic measurement devices
that are well-correlated with the human odor experience;
·
Develop accurate dispersion
models for odor, odorants, and PM appropriate to specific types of CAFOs,
addressing the inherent problems of Gaussian models;
·
Characterize air quality as
a function of distance from CAFOs;
·
Implement cooperative
industry/agency/university programs for scientific evaluation of new products
for producers’ consideration and adoption;
·
Assess the importance of
indoor air quality at CAFOs and devise ways to reduce exposure
levels;
·
Devise suitable
acceptability criteria for community-level exposure to odor and specific
associated gases;
·
Assess potential
relationships between emission constituents, concentrations, and potential
health indicators, and devise appropriate mitigation strategies
accordingly;
·
Establish partnerships with
health research organizations to identify potential health concerns associated
with CAFOs.
AIR QUALITY RESEARCH AND TECHNOLOGY TRANSFER WHITE PAPER AND RECOMMENDATIONS FOR CONCENTRATED ANIMAL FEEDING OPERATIONS
Report Prepared
by:
Confined Livestock Air
Quality Subcommittee
USDA Agricultural Air
Quality Task Force (AAQTF)
Introduction
Animal agriculture in the
U.S. is important to the nation’s economic well being, producing almost $100
billion per year in farm revenue contributing to the vitality of rural
communities and insuring the sustainability of America’s food supply (GAO,
1999). The U.S. has developed a
very efficient, sophisticated system for production of meat, milk, poultry, and
egg products involving concentrated animal feeding operations (CAFOs). For instance, the United States has 99.0
± 0.9 million cattle and
calves (average ± standard deviation for
1998-2000), and in 1999, a monthly average of 10.32 ± 0.75 million head were in
beef cattle feedlots being finished for slaughter (TCFA, 2000). These finishing cattle generally range
in liveweight from 272 kg (600 lbs) to 544 kg (1,200 lbs) per head, with an
average liveweight of approximately 408 kg/hd (900 lbs/hd). During a normal 150 day finishing
period, each animal excretes about 900 kg (2,000 lbs) of collectible manure, or
about 1,800 kg/hd (4,000 lbs/hd) of manure per head of feedlot capacity per
year. Cattle feedlots in the U.S.
produce an estimated 18 million metric tons/yr (20 million tons/yr) of
collectable manure containing at least 360,000 metric tons/yr (400,000 tons/yr)
of total nitrogen and 135,000 metric tons/yr (150,000 tons/yr) of total
phosphorus (P).
State and federal
regulations have directly addressed water quality protection from CAFOs since
the early 1970s. Accordingly, in
the last 30 years systems designed for manure and wastewater management have
historically been optimized for water quality protection to comply with EPA
effluent limitations guidelines (ELGs) adopted in 1974 and 1976, and currently
being updated. Most states have
surpassed USEPA in requiring groundwater protection measures, nutrient balances
for land application of manure and wastewater. Air quality protection has received
secondary consideration. Changing
regulatory priorities now have begun to include phosphorus and pathogens in
water quality goals and particulate matter, odor, and/or specific odorants in
air quality as goals. For example,
ammonia volatilization was considered a desirable means to balance N for land
application, and only recently has ammonia loss been viewed as a potential
problem in terms of air quality considerations.
Water and air quality issues
are interrelated. There has been a
major lack of adequate research to deal with both water and air quality issues
in a holistic systems approach while maintaining high standards of confined
livestock productivity, animal health, and production cost efficiency. For example, EPA’s anticipated update of
Effluent Limitation Guidelines will likely embrace phosphorus (P) limits in land
application criteria, and lead toward reduced manure and wastewater application
rates in some watersheds. In turn,
this may increase producers’ incentives to reduce N loss and retain N to more
nearly balance nitrogen application rates.
Increased funding is needed for research and development that will
properly quantify particulate matter (PM) and gaseous emission rates as a
function of system design and operational parameters. Public interest in these issues will
need to be tempered by realizations of needed
lead time, resources, and
appropriate technologies for producers to meet a changing public agenda and
avoid major dislocations in animal agriculture, which is an area of very
significant U.S. leadership in the world.
AIR QUALITY PARAMETERS AND
CONCERNS
Concentrated animal feeding
operations (CAFOs), including swine and poultry operations, dairies and cattle
feedlots and the associated animal waste management systems may produce
emissions of odor, odorants, odorous gases, such as ammonia, H2S,
VOCs, “greenhouse” gases (CO2 and CH4), and PM. Regardless of type of contaminant, the
emissions load on the atmosphere in terms of mass per unit time is the product
of contaminant concentration and the air flow rate (e.g., load = concentration x
ventilation rate).
1. Odor and Odorants
Principal sources of odor
emissions may include:
- Production Facilities -- open lot and confinement buildings;
- Manure/wastewater storage and/or treatment systems-- ponds, pits, lagoons, stockpiles, composting operations;
- Land application systems for solid or
liquid manure, treated effluent, or open lot runoff; and
- Animal
mortalities/carcasses.
Odor may become an annoyance
to, and affect the well being of, nearby residents. Odorous gases (odorants) arise from feed
materials, fresh manure, and stored, decomposing or treated manure, and
wastewater. Eaton (1996) listed 170
different compounds present in swine manure odor. Odorous gases emitted from animal waste
include ammonia and amines (Hutchinson et al., 1982; Peters and Blackwood,
1977), sulfides, volatile fatty acids, alcohols, aldehydes, mercaptans, esters,
and carbonyls (National Research Council, 1979; Miner, 1975b; Barth et al.,
1984; ASAE, 1999a). Peters and
Blackwood (1977) listed 31 odorants identified at cattle feedlots, together with
their threshold limit value (TLV) in ppm and odor threshold (ppm), where
known. An olfactory threshold value
detected by human panelists is the concentration where half the panelists detect
and half do not detect an odor.
Consequently, the threshold value may span a range as great as 5 or 6
orders of magnitude for a single compound and range from as low as 7.5 x
10-8 ppm for skatole to as high as 12,000 ppm for formaldehyde
(Eaton, 1996). For instance,
ammonia has reported odor threshold values spanning three orders of magnitudes
ranging from 0.0317 ppm to 37.8 ppm (Eaton, 1996). Concentrations of odorants at downwind
locations are very low; however, some may exceed olfactory threshold values and
create nuisance conditions (Sweeten, 2000b). Odorous compounds generally have not
been considered toxic at concentrations found downwind of livestock feeding
facilities. Mackie et al. (1998)
and Tamminga (1992) cited lowest toxic values (LTV) of frequently cited odorous
gases from confinement buildings.
These LTV values were from 5 to 20,000 times higher than cited odor
threshold values for these compounds.
However, recent evidence suggests potential for adverse health effect in
some instances (Wing and Wolf, 1999).
Odor characteristics that
contribute to nuisance conditions are as follows: (a) the intensity, concentration or
strength of the odor; (b) the odor frequency or number of times detected during
a time period; (c) the duration of the period in which the odor remains
detectable; (d) the perceived offensiveness and character or quality of the odor
(Jones, 1992). These factors
interrelate in causing nuisance conditions. Odor frequency and duration are partly
dictated by climatic conditions, including wind-direction frequency, atmospheric
stability, and moisture conditions.
A weak link in developing
odor abatement technologies has been an inability to precisely quantify odor
strength with sufficient reproducibility and accuracy (Clanton et al.,
1999b). Odor measurement methods
have been applied to animal waste management systems (Bulley and Phillips, 1980;
Barth, et al., 1984; Watts, 1991; Sweeten, 1995; McFarland and Sweeten,
1995). General approaches to
estimate the strength or intensity of livestock manure odors
include:
a. Sensory methods that involve
collecting and presenting odor samples to human panelists (diluted or undiluted)
under controlled conditions, e.g., Scentometer, dynamic olfactometers,
suprathreshold referencing methods, absorption media, etc.
b. Measurement of concentrations of
specific odorous gases (directly or indirectly).
c. Electronic “nose” devices that
register presence, concentration or activity of selected odorous
gases.
Olfactometry is the most
widely used method to evaluate odor concentration. Perhaps the simplest method of field
sensory odor concentration measurement is the Barnebey-Sutcliffe Scentometer
(Barnebey-Cheney, 1987). This
simple, portable field instrument involves direct sampling of the ambient air,
and it has been used as the basis for setting property line odor concentration
standards by several states (e.g., Colorado, Montana, North Dakota) and
cities. The Scentometer has also
been used for field odor measurement at numerous livestock and poultry
operations in the U.S. (Sweeten et al., 1977; Sweeten et al., 1983; Miner and
Stroh, 1976; Sweeten et al., 1991) and in data collection contributing to
nuisance litigation (Sweeten and Miner, 1993). The use of suprathreshold referencing
(ASTM, 1975) for measuring intensity of livestock waste odor was described by
Sweeten et al. (1983 and 1991). The
deployment and improvement of dynamic triangle forced-choice olfactometers
(DTFCO) (ASTM 1991; Dravnieks and Prokop, 1975) for livestock odor research is
occurring rapidly (Watts, 1991; Jones, 1992; Nicolai et al., 1997; Li et al.,
1997) and appears to be the instrumentation of choice for sensory odor
measurement for current research.
For instance, Lim et al. (1999) reported odor concentrations, measured by
8 panelists with a dynamic triangle forced-choice olfactometer, for swine
nursery buildings with underfloor liquid manure storage pits, as 190 odor units
(OU)/m3 in the exhaust air and 18 OU/m3 outside the
building. The data were used to
calculate an odor emission rate per head (51 OU/hd/sec) or per unit area (2.1
OU/m2/sec) using airflow rate data. Regression relationships were found
between odor concentration, odor intensity, and odor offensiveness. Similar data using a DTFCO system was
reported by Heber et al. (1998) for four 1,000 head finishing buildings, which
produced an average odor concentration of 294 ± 65 OU (range of 12-1,586
OU), and an emission rate of 96 ± 30 OU/hd/sec, or 5.0
OU/m2/sec.
Pain et al. (1988) used a
small wind tunnel (2 m x 0.5 m x 0.45 m) to collect samples of odorous air and
to measure ammonia emissions following the surface spreading of liquid dairy
cattle manure (1 to 2 day storage time), before and after mechanical separation
with a roller press, onto grassland in the United Kingdom. Odor samples were collected beneath the
flexible plastic sheet canopy into 50 L Tedlar bags inflated within 4 to 5
minutes time. Odor concentration
was measured by 4 to 8 panelists using dynamic olfactometry with 4 to 6
dilutions of each sample presented for determination of the odor threshold
(ED50) value. The odor
emission rate was calculated as the product of odor units (OU) and the
volumetric airflow rate (odor units/m2/hr). The odor emission rates measured by Pain
et al. (1988) for liquid dairy manure spread on pastures were reported by Smith
and Watts (1994) at 22 OUm/s and 11 OUm/s at time intervals of 3 and 48 hours,
respectively, after spreading. In
essence, the odor emission rate was reduced by 50% two days after spreading
liquid manure. Similar values were
obtained for swine manure slurry.
Total odor emissions were similar for whole dairy cattle manure slurry
and separated slurry (Pain et al., 1988).
Despite standardization and
control procedures to reduce bias, elements of subjectivity and sources of
imprecision remain in odor measurement with sensory panels. Combined with the high cost per sample
of large odor panels, this creates the need for reproducible, inexpensive
instruments that mimic the human olfactory response (Lacey,
1998).
Clanton et al. (1999b)
evaluated several possible sources of variation in determining dilution to
threshold odor units using a dynamic triangle forced choice olfactometer. For the same samples, two different
8-person odor panels consistently produced 22 to 50% differences odor
concentration (measured in odor units), depending on odor strength. Two different olfactometer airflow rates
resulted in 9 to 28% differences in odor units. There were large differences in
individual panelist sensitivity to odor detection and likewise variations by
individual panelists across different testing days and within a testing
session. A learning curve for
individual odor panelists was demonstrated. To improve the probability of detecting
significant reductions in odor resulting from a particular treatment, Clanton et
al. (1999b) recommended that several identical pairs of air samples will be
needed, together with a sufficient number of panelists to achieve statistically
significant differences with current olfactometry
technologies.
Considerable effort has been
devoted to identification and measurement of specific gases within the
atmosphere of livestock and poultry confinement buildings (Burnett, 1969; Elliot
et al., 1978; Hammond and Smith, 1981).
A large number of odorous compounds are present in very low
concentrations. Miner (1974)
reported that the measured concentration of each gaseous compound identified in
animal waste odor was below the reported minimum olfactory threshold. Zahn et al. (1997) reported that
volatile organic acids with carbon numbers from 2 to 9 demonstrated the greatest
potential for accounting for manure odor.
Instruments available to
identify and measure the concentrations of specific odorous gases (odorants)
emitted from animal manures include gas chromatography and mass spectrometry
(GC/MS) (White et al., 1971; Hammond et al., 1974). These methods are very sensitive in
detecting compounds in very low concentrations. Peters and Blackwood (1977) reported
difficulty in positively identifying compounds present in feedlot air samples
using GC-FID (gas chromatography-flame ionization detector) technology. Low peak values precluded the use of
GC/MS for amines. As a result of
the low concentrations of many odorants in and around CAFOs, the compounds may
need to be concentrated further prior to analysis by use of methods such as
solvent desorption, thermal adsorption (Wright, 1994: Zahn et al., 1997) or
solid-phase microextraction (SPME) (Zhang et al., 1994).
An electronic nose is an
array of gas sensors that are combined with pattern recognition software to
mimic human olfactory response (Lacey, 1998). Current commercial applications are
focused on high-valued food products.
Lacey (1998) and Mackay-Sim (1992) listed electronic approaches to
volatile gas (odor) detection: metal-oxide semi-conductors; field-effect
transistors; optical fibers; semi-conducting polymers; and piezo-electronic
quartz crystal devices. These
approaches raise the possibility of remote odor monitoring/surveillance networks
for individual compounds or odorant mixtures. The piezo-electric crystals are
sensitive to changes in surface mass caused by interaction with gaseous
molecules. As mass is added to the
surface, the resonant frequency decreases.
The sensor surface can be designed to respond to single chemicals or
groups of chemicals. Berckmans et
al. (1992) in Belgium developed a thick film semiconducting metal oxide sensor
for monitoring ammonia concentrations within, and emissions from, livestock
confinement buildings. Some sensors
may be affected by water vapor, methane, and temperature (Lacey,
1998).
Collection and storage of
odorous air samples for presentation to panelists or instrumental analysis is an
important consideration (Sweeten, 1995).
Tedlar bags (10-50 L) that are inflated in the field using portable wind
tunnel or negatively-pressurized canisters have become the most commonly used
method.
Schmidt et al. (1999)
described wind tunnel design parameters for odor sampling and concluded that
odor and hydrogen sulfide concentrations and corresponding emission rate
increase with bulk wind speed of the tunnel according to a power function
relationship. Results of Schmidt et
al. (1999) corroborated earlier work by Smith and Watts (1994b) on open
unsurfaced cattle feedlots.
2. Major Gases of Concern – Ammonia
and Hydrogen Sulfide
Ammonia is one of the fixed
gases of both aerobic and anaerobic decomposition of organic wastes. Much of the nitrogen excreted by cattle
is in the form of urea, which rapidly hydrolyzes to NH3. Additional NH3 as well as
amine are produced during microbial breakdown of fecal material in confinement
buildings, on feedlot surfaces, in stockpiles, and in lagoons or runoff
retention ponds. Ammonia evolution
rates are a function of time, temperature, pH of the manure surface, and level
of biological activity. Ammonia
(NH3) volatilization is probably the most important pathway for
on-site loss of nitrogen in animal manure to air and water resources. There are four main sources of ammonia
emissions on a commercial swine facility: confinement buildings, manure and
storage treatment lagoons, land application of lagoon effluent to cropland, and
potential NH3 re-emission from the soil (Aneja et al., 2000a). In the atmosphere, ammonia can react
with acidic species to form ammonium sulfate, ammonium nitrate, ammonium
chloride, or particulate (Aneja et al., 2000a). Battye et al. (1994) reported that
ammonia in the atmosphere can have a significant effect on oxidation and
deposition rates of acidic compounds.
Ammonia concentrations can
be measured by packed bed chemical-specific syringe tubes that are primarily
used in occupational safety and health applications (Sweeten et al., 1991). A second approach is GC/MS as mentioned
previously in which odorant samples are presented to the GC/MS either by vapor
syringe or by solid-phase microextraction.
The third approach is an ammonia (and amine) absorption trap in which a
known volume of air is passed through a weak acid media: sulfuric acid solution
(Luebs et al., 1974; Hutchinson et al., 1982; Cole and Parker, 1999); boric acid
solution (Moore et al., 1995; O’Halloran, 1993); sulfuric acid-impregnated
fiberglass (Peters and Blackwood, 1977).
The ammonia-absorption technique allows for comparisons of ammonia
concentrations and emission rates between various times and locations (White et
al., 1974). A fourth approach
(Oosthoek and Kroodsma 1990; and Phillips et al., 1995), involves
chemoluminescence, in which ammonia and NO2 are converted to NO at
750°C. In a split airstream at 350°C, the NO2 is
converted to NO. Ammonia
concentration is calculated as the difference in NO concentration between the
350° and 750°C airstream. Prior U.S.
research has indicated that ammonia is emitted from surfaces of open, unpaved
cattle feedlots and dairy corrals at concentrations of 360-980 mg/m3 as compared
to background levels of 1-4 mg/m3 (Sweeten et
al., 1999). Ammonia volatilization
losses are reportedly 50% or more of total N excreted from open lot surfaces and
23-70% following field spreading of manure.
Luebs et al. (1974) measured
ammonia concentrations at 1.2 m height upwind and downwind of open-lot dairy
operations near Chino, California, in which 145,000 dairy cows were concentrated
in several farms within a 60 square mile area near Los Angeles. Concentrations of ammonia (distillable
nitrogen) were below the odor threshold concentrations reported for
ammonia. An ammonia concentration
of 540 Fg/m3 was measured
at the downwind corral fence of a 600-cow dairy. This concentration was reduced to 18
Fg/m3 at a
downwind distance of 0.5 miles (0.8 km).
By comparison, ammonia concentrations were 92 ± 89 Fg/m3 at Chino
airport near the center of the dairy area and 4 ± 2 Fg/m3 at a
non-agricultural reference site. Diurnal fluctuations were observed in ammonia
concentration at the Chino airport with highest concentrations between 1800 and
2200 hours (184 Fg/m3) and 0600 to
1000 hours (128 Fg/m3). Much lower ammonia concentrations
occurred in afternoons 1400 to 1800 hours (6 Fg/m3). Fenceline observations at an individual
dairy did not coincide with the diurnal pattern at the center of the dairy
area.
Ammonia volatilized from
liquid dairy manure slurry spread on pastures was measured (Pain et al., 1988)
by drawing air samples from the tunnel inflow and outflow sections through
absorption flasks containing orthophosphoric acid (0.005 M). Ammonia losses following application
were 23 to 70 percent within 10 to 14 days after application, although 80
percent of these losses occurred within 2 days of application. There was a strong correlation
(r2 = 0.94) between odor emissions and ammonia emissions following
application of dairy cattle slurry to the grassland pasture. A similar relationship was obtained for
swine manure slurry. A greater
proportion of ammonia was lost from dairy cattle slurry than from swine
slurry.
Montes and Chastain (2000)
evaluated ammonia losses from sprinkler irrigation of swine lagoon effluent at
two tree plantations (2 and 8 years old) in South Carolina. As compared to prior research of others
(1980-1997) which reported 10-60% ammonia-nitrogen loss through sprinkler
irrigation, they observed erratic losses ranging from (-) 40% to (+) 38%, with a
mean value of 2% ± 16%.
Keck (1997) determined the
influences of manure removal frequency, climatic conditions, and exposed surface
area on ammonia emissions from cattle exercise yards and from wind tunnel
simulations of 7 m2 manured surfaces where airflow volume could be
determined. Ammonia concentration was determined using HCl absorption. Urine caused more than 8 times greater
ammonia emission per unit area than feces (205 mg/m2h vs. 25
mg/m2/h). Daily removal of manure (feces and urine) produced a small
decrease in ammonia emission compared to removal at three-day intervals. Ammonia
emissions were greater in warm season than in cold weather. Reducing the surface
area of manure decreased the ammonia emission.
Schmidt et al. (1997)
conducted field measurements at 5 dairies in Southern California during winter
and summer seasons to determine surface emission rates of ammonia and other
compounds implicated in contributing to PM 10 emissions. Sampling was conducted using a surface
isolation flux chamber (EPA, 1986). Of the compounds studied, ammonia had the
highest flux rate. Manure
stockpiles that were disturbed produced the highest ammonia flux rate. Amine
compounds were not detected above the detection threshold. The average ammonia
emissions for 4 dairies was 11.2 ± 4.3 kg/cow/year projected
from the late summer/early fall testing period, and was 4.8 ± 1.1 kg/cow/yr projected
from the winter testing period.
Oosthoek and Kroodsma (1990)
reported monthly ammonia concentrations of 3.0-4.8 mg/m3 from a
40-cow dairy free-stall housing unit.
Monthly ammonia emission rates ranged from 39 to 60 kg/month, or 1 to 1.5
kg/head/month, where cattle were housed at night. A scraped concrete floor had three times
the ammonia emission rate of a flushed concrete floor (600 mg/m2/hr
vs. 200 mg/m2/hr).
Peters and Blackwood (1977)
measured both ammonia and hydrogen sulfide concentrations at two cattle
feedyards on the Texas High Plains.
These one-time measurements were:
a. Ammonia -- 104-120 mg/m3
b. Total Sulfide -- 5-27.5
mg/m3
There was no correlation
between the NH3 and H2S
concentrations.
Battye et al. (1994)
examined the European literature to arrive at what they termed “rough estimates”
of ammonia emission factors for agricultural and nonagricultural sources in the
U.S. The NH3 emission
factors recommended for use in future U.S. emissions inventories were based
primarily on European factors for animal agriculture and fertilizer
application. The relative
contribution of animal agriculture to the total U.S. ammonia emission inventory
was extrapolated to be as follows: all cattle and calves (43.4%); swine (10.7%);
poultry (26.72%); sheep and lambs (0.7%).
All other sources constituted only 18.5% of total estimated ammonia
emissions but several sources including undisturbed soils were not
evaluated. The “all cattle and
calves” inventory included both unconfined (range and pasture) beef and dairy
cattle as well as beef feedlots and dairies, and similarly for the sheep and
lambs category. The primary source
of data for the Battye et al. (1994) assessment was Asman (1992), who summarized
literature in the Netherlands through 1990. Battye et al. (1994) recommended several
research areas, including U.S. animal agriculture, to enhance the quality of
ammonia emission factors available.
Factors influencing ammonia
emissions from livestock operations include (Battye et al., 1994): type and size
of animal; ration N and amino acids content; N digestibility and conversion;
confinement housing system; and manure handling system. Following spreading, ammonia emissions
are influenced by: climatic conditions, soil properties, manure properties,
application rate, application method, and timing of soil
incorporation.
Buijsman et al. (1987)
likewise produced ammonia emission factors from data in the United Kingdom. The ammonia emission estimates of Asman
(1992), Buijsman (1987), and NAPAP represented both confined and unconfined
cattle and sheep, with values for the pastured animals reportedly higher than
confined animal. Likewise, larger
animals within species reportedly produced higher ammonia emission factors, and
vice versa. However, the data sets
failed to distinguish in similar terms among types of production systems,
housing, or sizes of animals used for the data series, nor between monitoring
methods. Table 1 shows a comparison
of NH3 emission factors for the three European studies and a derived
composite value of Battye et al. (1994) for use by EPA, in which they took into
account types, size, ranges and numbers of farm animals in the U.S. The National Acid Precipitation
Assessment Program (NAPAP) for the U.S. (Warn et al., 1990) reported
NH3 emission factors that Battye et al. (1994) described as “quality
rating E (lowest possible).”
Preliminary estimates of
ammonia emissions from typical open-lot dairies and beef cattle feedlots in
California were developed by the California Air Resources Board (CARB, 1999),
which commented that because of “uncertainties in the number of animals and the
ammonia emissions per animal, it is not possible to produce precise measurements
of regional livestock emissions as can be done for factories or cars”. Their estimates for livestock are based
on averages in developing an ammonia emissions summary for 15 air quality
basins. Difficulties in arriving at
these estimates included partitioning cattle numbers, liveweights, and time
segments into different phases of each type of operation using standard
livestock statistics developed for other purposes. Moreover, CARB (1999) stated that
researchers’ attempts to quantify ammonia emissions from cattle are “an
extremely difficult process; in that emissions vary by type of ration, climate
conditions (temperature, humidity, etc.), type of animal housing or stabling,
where and how measurements were taken, and diverse activities that may
contribute ammonia (e.g., grazing, confinement, manure
handling/storage/spreading, etc.).”
Because of these
difficulties, CARB (1999) estimated emission factors for cattle feedlots based
on the Battye et al. (1994) report, which itself was based on European data
(Asman, 1992) as noted previously.
Accordingly, the weighted-average composite beef cattle emission factor
for all beef cattle and calves in California was taken as 18 lbs
NH3/hd/year. Similarly,
the derived composite estimate for dairy cattle was 30 lbs
NH3/hd/year, as compared to cited emission factors of 17-87 lbs/hd/yr
for dairy cattle.
Data on ammonia
concentrations in cattle feedyards and emission flux rates (mass per unit area)
are sparse, and area from feedlot and holding pond surfaces is sparse. Ammonia-nitrogen (NH3-N)
concentrations measured on 13 days from a 120,000-head feedlot near Greeley,
Colorado, Hutchinson et al. (1982), were compared with measured background
concentrations of 1-4 Fg
NH3-N/m3.
Average concentrations above the feedlot surface were 520 ± 309 Fg/m3. Concentrations on the 10 “dry days”
averaged 361 ± 46 Fg/m3, and peak
concentrations occurred either when the feedlot was drying out (2 days) after
rainfall (1,090 mg/m3) or during
an inversion (1 day), when the concentration was 970 Fg/m3. Conversion of concentration data to flux
densities requires site specific concurrent data on wind speed, temperature,
solar radiation, and boundary layer thickness. Hutchinson et al. (1982) estimated
vertical flux densities of 0.64-2.37 kg N/ha/hr, with an average value of 1.4 kg
N/ha/hr. The highest ammonia
concentrations and flux densities were measured when the feedyard surface was
drying out after rainfall.
Ashbaugh et al. (1998)
conducted several field studies in the San Joaquin Valley, California, to
determine upwind and downwind ammonia concentrations. Ammonia concentrations were highly
variable from different parts of the dairy. Secondary ammonium nitrate particles
form in the atmosphere from ammonia gas and nitric acid. Dairy facilities used were a 2,050 cow
free stall (milking herd size) with 2,350 non-producing heifers on property in
open corrals. The flushed manure
from the free stall barn and milking parlor entered a two-stage solids
separation system (gravity settling basin and mechanical separator) followed by
a primary (single-stage) anaerobic lagoon.
Solid manure was collected from drylots by conventional scraping. Ammonia was sampled using two
approaches:
·
Active samplers -- two-stage
boric acid traps;
·
Passive samplers -- citric
acid coated filter Teflon protective filter inside a standard Millipore filter
cartridge, further described in Freitas et al. (1997).
Meteorological conditions
were monitored to a 12-meter height to allow calculation of ammonia flux and to
determine data quality. The
vertical flux (mass/unit area/unit time) was used to calculate an emission rate
in mass/unit time. The emission
factor was calculated from the emission rate divided by the number of animals at
the dairy. Diurnal effects were
noted as emission factors ranged from 24 lbs/hd/year at night to 227 lbs/hd/year
in the late morning. These results
(Ashbaugh et al., 1998) appeared to bracket the following prior estimates/
measurements of emissions factors for dairy cattle:
Prior Source
lbs/hd/year
Data Source
· Battye et al, 1994
87.6
Europe
· Gharib & Cass, 1984
48.9
S. California
· James et al., 1997
74 ± 130
San Joaquin Valley
· Schmidt et al., 1997
11-25
S. California
Atwood and Kelley, 1996
Ni et al. (1998) observed
ammonia emissions from a 1,000 head swine finishing building with underfloor
liquid manure storage pit of 11.2 ± 4.6 kg/day, or about 13
g/day/head on feed. These
in-building concentrations were generally lower than reported in the European
literature. The emission rate
varied with pig weight, ventilator rate, and indoor air
temperature.
Stowell et al. (2000)
obtained average ammonia concentrations of 16.1 ± 11.6 ppm in fan exhaust air
from a finishing building for 960 hogs with a solid manure handling system,
although concentrations varied among fans and between sampling events. The average ammonia emission rate for
this unconventional type of swine housing was 27.6 g/min (4.1-59.0 g/min), or 41
g/day/head, which is about three times the value of Ni et al. (1998)
(above). The ammonia concentration
diminished rapidly with downwind distance from exhaust fans, to only 1.8 ppm at
3 m, 0.3 at 15.2 m and 0.1 ppm at 30.5 m (100 ft).
Tanaka (2000) determined
that 80% of the ammonia emissions from a forced-aeration dairy manure/sawdust
composting system occurred within the first 3 days, and 90% of ammonia losses
occurred within the first 2 weeks.
Ammonia loss was accelerated by low C/N ratio, with finished compost
substituting for sawdust. These
results are consistent with Sweeten et al. (1991) who used a negative-pressure
collection system to capture and treat (via biofilter) gases from the first week
of a 4-week composting cycle for fresh caged layer manure plus peanut
hulls.
Aneja et al. (2000a)
measured seasonal fluxes of ammonia nitrogen (NH3-N) from a 6.1 acre
(2.5 ha) x 13 ft (4 m) swine manure treatment lagoon at a 10,000 head (~ 1,000
sow farrow to finish) operation in North Carolina for nearly a year
(1997-98). A floating dynamic-flow
flux chamber was used to capture and sample gaseous emissions. Ammonia fluxes varied seasonally ranging
from an average of 305 (February) to 4,017 (August) FgN/m2/minute
(Table 2).
The ammonia flux increased
exponentially as the lagoon surface water temperature increased from
8°C to 38°C (Aneja et al., 2000a and
b). This is related to diffusion
and mass-transfer principles. There
was no correlation between ammonia fluxes and total Kjeldahl nitrogen
concentrations in the lagoon supernatant.
They used GIS satellite images of North Carolina swine lagoons surface
areas, along with the above season average flux rates to compute an estimated
total ammonia emissions from swine lagoons. The total for the lagoons was estimated
to be 33% of the state’s total swine ammonia emissions of ~68,450 tons
NH3-N per year, with the total developed independently from other
published sources, including Battye et al., 1994.
Brewer and Costello (1999)
reported that ammonia fluxes from broiler litter (initial equal mixture of rice
hulls and pine shavings) increased with number of grow-out cycles in which the
litter was reused. Ammonia fluxes
averaged 149 mg NH3-N/m2/hour (range of 0 - 314) during
the first grow-out cycle and 208 mg NH3-N/m2/hour (range
of 40-271) on reused litter. Flux
values varied by location within the broiler houses, and were greatest adjacent
to watering locations due to greater manure deposition and water spillage. Variations also occurred with respect to
bird age, being least during the first week and highest after 15 days through
the end of the grow-out period.
Ammonia flux from new litter was less than from old (reused) litter only
during the first 3 weeks of the initial grow-out period.
Ammonia from swine
facilities in a six-county region with an average hog population of 1,350
hogs/sq mile (528 hogs/km2) in North Carolina are believed to be
impacting precipitation caught in National Atmospheric Deposition
Program/National Trend Network (NADP/NTN) monitoring sites up to 50 miles (80
km) away (Walker et al., 2000).
Hydrogen sulfide is one of
the main gases produced from anaerobic decomposition of swine manure, and can
cause serious indoor air quality problems in confinement swine buildings with
underfloor manure storage pits (Arogo et al., 1999). H2S can cause adverse health
effects to animals and humans (dizziness, headache, irritation, etc.) at
concentrations as low as 10 ppm, and at high concentrations can cause
death. Hydrogen sulfide is formed
and released at low pH conditions (below 7), and is nonexistent at pH above 9 or
10. Arogo et al. (1999) found that
the mass transfer coefficient of H2S increases with liquid manure
temperature, and that higher emission rates of H2S are likely to
occur when liquid temperature is higher than air
temperature.
The Minnesota Pollution
Control Agency (MPCA) recommended three methods of H2S monitoring
(Sullivan et al., 1999):
a. Total Reduced Sulfur (TRS) --
continuous method that uses a thermal oxidizer to convert reduced sulfur
compounds including H2S to a measurable form with an EPA approved
sulfur dioxide analyzer;
b. Sensitized paper tape monitor --
continuous monitor that detects and quantifies dark stain produced by
H2S;
c. Gold film H2S monitor --
portable, handheld H2S gas analyzer; suitable for grab
samples.
MPCA monitored 137 animal
feeding facilities for hydrogen sulfide emissions in 1998, and found that 24
operations demonstrated a “potential to exceed” the state’s ambient air quality
standard of 30 ppb for a one-half hour averaging period.
The MPCA team’s observations
were not uniformly distributed based on animal species, size or type of
operation, and half were selected based on prior complaints. Highest concentrations came from swine
and poultry facilities total confinement systems, and from earthen storage
basins for liquid manure (not treatment lagoons). There was essentially no correlation
between size of operation (based on number of head) and H2S
concentrations at or near the property line (Sullivan et al.,
1999).
Bicudo et al. (2000)
continuously monitored H2S at and around three swine farms
(1,800-3,000 hd) and one dairy farm (667 hd) in Minnesota for 30 days. The continuous air monitors were located
at varying distances and directions from the confinement buildings or earthen
basins. Agitation and pumping of
the manure storage units occurred for 1 to 10 days in August or September. Air samples collected in 10 L Tedlar
bags for analysis by odor panels or H2S instrumentation. Peak concentrations of H2S
during agitation and pumping of earthen basins for manure storage were
significantly higher than from the basins with deep pits, and frequently
exceeded the 92 ppb recording range of the continuous air monitors for about 4
hours, then decreased rapidly to levels below 30 ppb. Even during agitation and pumping, odor
concentration (OU) and H2S diminished rather rapidly with distance
downwind, to levels of below 20-50 OU and 0-30 ppb, respectively, at distances
of 200-250 m.
Ni et al. (1999a) reported
H2S emission rates from two 1,000 head grow/finishing swine buildings
with underfloor liquid manure storage pits. H2S emission rates
averaged 0.591 kg/day per building (range of 0.32-1.867 kg/day), which equated
to 740 mg H2S/day/m2 building floor area. Average H2S emission per head
of building capacity was 6.3 mg/hd/day.
Emission rates for H2S were directly proportional to room
temperatures and airflow rates but pig size was not a significant
parameter. According to Ni et al.
(2000), prior work has reported 5 to 95 mg H2S/m2/hour
from swine finishing buildings in the Upper Midwest. There is a need to identify other
important odorous compounds and determine how they are generated and how to
control them. Ni et al. (2000)
found that SO2 was produced in simulated liquid manure storage pits
along with H2S, but at about one-tenth the concentration (e.g., 20-25
ppb SO2). Releases of
H2S fluctuated more drastically than for
SO2.
3. Particulate Matter –
PM10 & PM2.5
The cattle feedlot industry
is under increased scrutiny and regulatory involvement at state and national
levels with regard to particulate matter (PM) emissions from fugitive
sources. USEPA (1987) replaced the
total suspended particulate (TSP) standards for all sources in the U.S. with a
PM10 standard based on particulate matter (PM) having mass median
diameter of 10 microns (Fm) (AED). In essence, the revision was based on
the premise that relatively fine, rather than coarse dust, needs to receive
greater focus in protecting human health.
The PM10 primary and secondary 24-hour standards were changed
to 150 Fg/m3 for a
24-hour average with no more than one exceedance per year (USEPA, 1987). Two instruments (manufactured by Wedding
and Associates and by Sierra Andersen) were accepted for PM10
measurement by the USEPA, and other instruments or methods have been developed
as well (Herber and Parnell, 1988).
A procedure developed by
Raina and Parnell (1994) involved use of a Coulter Counter to determine particle
size distribution of particulate collected with a high volume sampler and, based
on these measurements, mathematically deriving the PM10
concentration. Their data with
agricultural processing dusts suggested that the Coulter Counter method may give
a more accurate indication of (a) median aerodynamic particle diameter, and (b)
cumulative PM10 concentration.
With increasing concerns
for human health effects believed caused by fine particulate matter (respirable
dust), the USEPA proposed new National Ambient Air Quality Standards (NAAQS) in
July 1997. The proposal would
provide new primary and secondary standards for PM2.5 (AED). The proposed 24-hour primary and
secondary PM2.5 standard was 65 Fg/m3 calculated as the 3 year average of
the 98th percentile reading at each monitor. The proposed annual standard was 15
Fg/m3 as the 3-year average of annual
arithmetic means. In addition to
the new PM2.5 standard, the 1987 NAAQS for PM10 would be
left in place, except that the PM10 exceedance criterion for 24 hour
samples would be changed to 99th percentile (i.e., 4th
highest concentration) rather than one exceedance per year. It is important to note that the
proposed new NAAQS has not been adopted by USEPA due to a 1999 court
decision. The current NAAQS for
PM10, as well as the other criteria pollutants are provided in Table
3. The PM10 primary
standards are 50 Fg/m3 for the annual arithmetic mean, and
150 mg/m3 as the 24-hour maximum concentration
(Woodford, 2000).
Measurements of total
suspended particulate (TSP) with standard high volume samplers both upwind and
downwind of 25 California feedlots during the summer resulted in an average net
TSP concentration of 654 Fg/m3 with a range
of 54 to 1,268 Fg/m3 (Algeo et
al., 1972). The net TSP was the
difference between the downwind and upwind concentrations and reflected the dust
contribution from the feedlots. The
peak daily total suspended particulate concentrations were usually observed at
or just after sundown for 2 hours (1900 - 2200 hours local time), and ranged
from 1,946 to 35, 536 Fg/m3, averaging
14,200 ± 11,815 Fg/m3 for 10
feedlots (Elam et al., 1971). The
high peak dust concentrations in early evening result from increased cattle
activity as ambient temperatures drop following daytime heating. Dust control practices in place for 2 of
the 10 feedlots reduced concentrations to 1,446 and 3,153 Fg/m3 at the peak
hours. Minimum dust concentrations
observed in early morning (0600 hours) were one or two orders of magnitude below
the maximum and mean TSP concentrations.
At three Texas feedlots,
Sweeten et al. (1988) measured net particulate (TSP) concentrations for 24 hour
sampling periods. Net particulate
concentrations are the downwind concentration adjusted for upwind concentration
to reflect the contribution of the feedlot only. Net concentrations averaged 410
Fg/m3 and ranged
from 68 to 882 Fg/m3. For 4 and 5 hour time intervals within
the 24 hour sampling periods, the extreme range of TSP dust concentrations was
16 to 17,000 Fg/m3.
Concentrations of total
suspended particulate matter (TSP) and PM less than 10 micrometers
(PM10) aerodynamic equivalent diameter (AED) were measured, using
high volume samplers, and Sierra Andersen samplers respectively (Sweeten et al.,
1998). Particle size distributions
of dust captured on sampler filters were measured with a Coulter Counter model
TAII. Mass median diameters for
high volume and PM10 samplers averaged 9.5 ± 1.5 and 6.9 ± 0.8 Fm (AED), respectively. Three cattle feedlots (17,000 to 40,000
head capacity) in the Southern Great Plains were used in the
study.
TSP concentrations measured
at the same downwind locations for 5-hour time intervals ranged from 97 to 1,685
Fg/m3 TSP and
averaged 700 + 484 Fg/m3 TSP (Sweeten et al., 1998). Correspondingly, the PM10
particulate concentrations ranged from 11 to 531 Fg/m3 and averaged
285 + 214 Fg/m3. In all cases, these results represented
the approximate center of the downwind plume at the location of the samplers
(i.e., 15 meters to 61 meters beyond the feedpens). The Andersen PM10 sampler
yielded a much higher PM10/TSP ratio (0.40) than for two Wedding
PM10 monitors (0.19) used simultaneously in several experiments (data
not shown). Particles smaller than
2.5 mm (AED) represented
approximately 5% of TSP.
Guarino et al. (1999) found
that peak levels of dust released in a caged layer poultry building were
generated by rather sudden episodes of increased bird activity triggered by
noise, lighting changes, machinery, human activity, or increased
temperature. Diurnal patterns were
observed (highest during day and least at night). Increased total and respirable dust
levels resulted in increased poultry mortality.
4. Co-Product Gases – CO2,
CH4, and VOC
The major sources of
CO2 in swine buildings are space heating systems, animal respiration,
and massive biodegradation (Lim et al., 1998). Recommended maximum allowable
CO2 levels range from 1,500 ppm to 5,000 ppm for 8-hr human
exposure. Manure degradation can be
a major source of methane (CH4) and nitrogen oxides (NOx),
which contribute to the inventory of greenhouse gases (Mackie et al.,
1998). Emissions of nitrous oxide
(N2O) during the nitrification/dentrification cycle can contribute to
ozone depletion (Schulte, 1997). In
the U.S., methane emissions from animal wastes are 15% of the total (Mackie et
al., 1998; USEPA, 1992). Methane
fermentation occurs in many anaerobic ecosystems, including manure storage and
treatment, where the main electron acceptor, CO2, is produced from
the degraded organic substrates.
Lim et al. (1998) reported
CO2 concentrations in fan exhaust from an 880 hd grow/finish swine
building with total slotted floors and tunnel ventilation with curtain side
walls. Average CO2
concentration inside was 1,060 ppm (539-2,766 ppm range), as compared to 482 ppm
outdoors. Carbon dioxide production
averaged 3.0 kg/pig/day (1.2-9.5 kg/pig/day range).
Safley et al. (1992)
reported that the atmospheric concentration of methane (CH4) is
presently about 1.7 ppm; is increasing at the rate of 1% per year; and has more
than doubled over the last two centuries.
Methane contributes about 20% of the expected global warming effect,
behind carbon dioxide. Animal waste
contributes about 6-10% of the total worldwide anthropogenic methane emissions,
and North America ranks fourth, behind Eastern Europe, Asia/Far East, and
Western Europe, producing about 15% of the 28.3 Teragrams CH4/year
from animal waste. The principal
determinants of methane production from animal manure are: quantity and
characteristics, waste management system utilized, temperature, and
moisture. Methane is produced
during anaerobic decomposition, resulting from high moisture content and the
absence of oxygen. Systems that
bring the manure/wastewater in contact with oxygen (e.g., timely land
application on fields) reduce methane production. Anaerobic lagoons were estimated to
produce about one third of methane production from animal waste in North America
followed by extensive ranges/pastures, liquid manure/slurry storage, open lots,
solid storage, and land application.
Volatile organic compounds
(non-methane reactive organic gases) are recognized as a major precursor to
ozone formation. Currently, no
recognized emission factors for VOC exist for CAFOs from which states can
develop reliable emission inventories and/or cost-effective mitigation measures
where required.
Emission
Factors: A CASE FOR ACCURACY
1. Significance of Emission
Factors
Emission
factors
are estimates of the mass of pollutants per unit of through put or
capacity. For example, the emission
factor for particulate matter (PM) from a coal-fired power plant is usually
expressed in units of pounds per million Btu of thermal input; a cotton gin,
pounds per bale; and a cattle feedyard, pounds per thousand head per day. The
annual total suspended particulate (TSP) emissions from a 1,000 megawatt power
plant (30% efficient) with an emission factor of 0.03 pounds per million Btu is
1,494 tons per year; from a 20 bale-per hour cotton gin processing 20,000 bales
per year with an emission factor of 3.05 pounds TSP per bale is 30.5 tons per
year; and from a 40,000 head cattle feedyard with an emission factor of 280
pounds TSP per thousand head per day is 2,044 tons per year. (These example operations are well above
the average size for each industry.)
Emission factors are often
used in a regulatory context. The
use of emission factors by EPA and state air pollution regulatory agencies
(SAPRAs) can significantly impact agriculture. EPA has published estimated emission
factors for many types of operations in a document referred to as AP-42 (USEPA,
1986 and 1994). However, many of the agricultural emission factors in AP-42 are
proving to be incorrect and in need of updating.
EPA and SAPRAs use emission
factors in air pollution regulatory process in two ways:
a. to determine the emissions inventory for the operation
(tons per year), and
b. to estimate the downwind concentration that might be
expected from the operation.
The annual emissions
inventories are used to determine whether the operation is a “major
source”. For example, any point
source in an attainment area that emits more than 100 tons per year of a
regulated pollutant is classified as a major source and must pay an annual
emission fee to the respective state’s air fund. This fee is approximately $30
per ton of all regulated pollutants emitted.
Emission
rates
are the mass of air contaminant released per unit of time, calculated as (1) con-centrations in air times airflow
rate or (2) emission factor times capacity or through put. The emission rates of the example power
plant, cotton gin and cattle feedyard listed above are 341, 61, and 467 pounds
per hour, respectively based on AP-42 values (USEPA, 1986). Emission rates can be used to estimate
downwind concentrations with a dispersion model.
There is another factor that
impacts the air pollution regulatory process for PM. The National Ambient Air
Quality Standard (NAAQS) for particulate matter is a 24-hour concentration of
150 micrograms per standard cubic meter of PM10. PM10 is
particulate matter less than 10 micrometers aerodynamic equivalent diameter
(AED). In the examples listed
above, it is likely that the emissions from the power plant will consist
primarily of PM10 whereas only a fraction of the PM emitted by the
cotton gin and feedyard are PM10. It is generally accepted based upon
studies by Texas A&M University and USDA that the fraction of PM less than
10 Fm AED is less than 50% and
25% of the total PM emitted for cotton gins and cattle feedyards,
respectively. Hence, the emission
rates of PM10 that would likely be used for dispersion modeling
downwind from a power plant, cotton gin, and cattle feedyard would be 341, 30,
and 117 lbs/hr, respectively. Likewise the annual emission inventories for the
power plant, cotton gin, and cattle feedyard would be 1494, 15, and 511 tons/yr
of PM10. These emission rates would be correct assuming that the
initial AP-42 emission factor for total PM emitted was correct.
However, there are serious
problems associated with either incorrect or non-existent emission factors for
agricultural operations:
a. If the current AP-42 emission
factors are in error, the emissions inventory will be inaccurate. An inaccurate
emissions inventory will likely result in SAPRA or EPA strategies that are
inappropriate, i.e. if the emissions inventory were inordinately high as a
consequence of an excessively high AP-42 emission factor, excessive regulatory
actions will result in a focus on an agricultural pollutant source when in fact
the contribution of these sources may not be significant.
b. If the current AP-42 emission
factors are in error, modeling will result in incorrect estimates of downwind
concentrations, i.e. if the emission factor is too high resulting in modeled
concentrations at the property line exceeding the NAAQS, additional controls
will be required. In one state, modeled concentrations exceeded the NAAQS at the
property line but measured concentrations were less than the NAAQS and the SAPRA
indicated that they preferred the model results.
c. An even more serious problem is
when no AP-42 emission factor exists.
The SAPRA is likely to assume an emission factor for the agricultural
operation that is incorrect or inappropriate. For example, California is in the
process of permitting dairies. In
the absence of an AP-42 emission factor for dairies, the assumption was made by
the SAPRA that dairy operations are similar to cattle feedyards, and
consequently the inaccurate PM10 AP-42 emission factor for cattle
feedyards was used. Three mistakes
were made in this assumption: (1) Dairy operations are significantly different
from cattle feedyards; (2) dairy cattle do not exhibit the same aggressive
behavior patterns as beef cattle on feed, thereby do not create the same level
of dust emissions; and (3) the AP-42 emission factor for feedyards is
excessively high.
2. Emission Factors for Cattle
Feedyards and Dairies
The Department of
Agricultural Engineering at Texas A&M University has been attempting to
correct the AP-42 emission factor for cattle feedyards since 1992. In the latest study funded by the Texas
Natural Resource Conservation Commission (TNRCC), it was determined that the
appropriate PM10 emission factor for cattle feedyards should be 15
pounds per thousand head per day (lbs/1000hd/day). The AP-42 PM10 emission
factor for cattle feedyards is 70 lbs/1000hd/day. The factor developed in the TNRCC study
was approximately 1/5 of the emission factor listed in AP-42.
Dairy operations are
considerably different than cattle feedyards but there exists no AP-42 emission
factors for dairy operations.
Hence, the California Air Resources Board (ARB) has required that the
cattle feedyard emission factors be used.
This reflects a lack of knowledge of mechanisms of dust emissions at
dairies. The generation of
PM10 in an open feedyard or open dairy lot surface is a consequence
of the cattle (cows) walking on the manure pack entraining dust in air. Calves typically will be on the pavement
or on pasture and will not be disturbing the manure pack. Hence, one should not include the calves
in the determination of the annual PM10 emission inventory. The spacing of cows in dairies are
typically 500 to 1200 square feet per head (ft2/hd) in contrast to
cattle in feed yards at 150 ft2/hd. Milk cows are less active than cattle on
feed yards and are on paved alleyways and milking parlors for a portion of time
each day. Manure in open lot
dairies must be removed frequently for milk inspection purposes whereas there is
no manure removal requirement for feedyards. (Removing manure from feedyards is a
management practice used to reduce PM10 emission rates from cattle
feedyards.) Hence, it is logical to
assume that the frequent removing of manure at dairies will further reduce the
PM10 emission rate. It is likely that the emission factor for cows on
dairies will be significantly less than the emission factor for cattle on
feedyards. Sweeten (2000c) has
estimated that the dairy cattle PM10 emission factor would be less
than 20% of the cattle feedyard PM10 emission factor. If the emission factor used for the
TNRCC study (15 lbs/1000hd/day) is correct, a more appropriate PM10
emission factor for dairies would be 4 lbs/1000hd/day.
The use of an appropriate
emission factor for dairies in California is very important for the dairy
industry. If the ARB were to use an inappropriate and unfair PM10
emission factor for dairies in California, other states will likely use similar
numbers. At the same time, it is important that an accurate emission factor be
used so that the impact of the emissions of PM10 from this project on
the state’s non-attainment status can be quantified.
Table 4 shows the emissions
inventory calculations for four dairy projects in California using three
different emission factors. The
total PM10 emissions from the four proposed dairies range from 33 to
558 tons/year. Which annual emissions inventory figure is correct?
3. Errors in the AP-42 Cattle Feedyard
Emission Factor
Parnell et al., (1999) completed a TNRCC emission inventory study in December 1999: The goal was to report “the most accurate” emissions inventory for PM10 from cattle feedyards in Texas. A logical approach would have been to take the emission factor multiply times the number of head of cattle in the feedyards and report the results. For example, the current AP-42 (EPA, 1995) emission factor for cattle feedyards is 280 pounds of total suspended particulate matter (TSP) per 1000 head per day (lbs/1000hd/d). Based upon work published by Sweeten et al. (1988, 1998), EPA has adopted a policy that 25% of the TSP is PM10. Hence the current PM10, AP-42 emission factor is 70 lbs/1000hd/d. The problem with this approach is that if the emission factor is in error, the emissions inventory will be in error. In addition, this error will be magnified with the emissions inventory calculation. An emissions inventory is calculated by multiplying the emission factor by a large number such as 3 million head (the approximate number of cattle on feed in Texas). For our TNRCC report, we reexamined the basis for the AP-42 emission factor for cattle feedyards (see Appendix A).
Emission factors are also
used by modelers to estimate downwind concentrations from sources of pollution.
Inaccurate emission factors can result in inaccurate estimates of downwind
concentrations of PM10. Inaccurate estimates of downwind
concentrations can result in inappropriate, costly, and unfair imposition of
control strategies.
Agricultural engineers at
Texas A&M University have been conducting research with the goal of
correcting the AP-42 emission factor for cattle feedyards for a number of years
(Parnell, S., 1993, 1994, and 1995; Sweeten et al., 1988 & 1998; McGee,
1997). It has not been a simple task. Measurement of downwind concentrations
does not directly yield emission factors. In other words, a measurement of
PM10 does not directly reflect the emission rate or emission factor
of a fugitive source. The emission factor is affected by localized meteorology,
configuration of the yard, and the dispersion model used to back into the
emission rate.
The current AP-42 TSP
emission factor for cattle feedyards of 280 lbs/1000hd/d can be traced back to
Peters and Blackwood (1977) who used the data collected by Algeo et al.
(1972). The purpose of this
analysis is not to be critical of the previous research, but to point out
errors. By understanding what has
been used for a “scientifically based” emission factor, we can better justify
our approach and resulting emission factor. Peters and Blackwood used the net,
downwind, 24-hour concentrations reported by Algeo from sampling at 25
California feedyards. It should be
mentioned that these were the only data on net, downwind, 24-hour TSP
concentrations from feedyards available at the time. California is in a winter-rainfall area,
and feeds less than 5% of the nation’s cattle, in contrast to the
summer-rainfall climate of the Southern Great Plains, where 80% of the nation’s
cattle feeding activity is located.
The intent of the field sampling study by Algeo et al., (1972) was to
evaluate the performance of control strategies in reducing TSP and their
experiments were not designed to obtain data for the development of a cattle
feedyard emission factor.
Accordingly, neither weather data, locations of samplers, nor feedlot
orientation were reported. Several
unwarranted assumptions or miscalculations were used by Peters and Blackwood
(1977) in their source assessment contract report, which lead to an erroneous
EPA emission factor for cattle feedlots, based solely on summer time TSP data at
California feedlots. Some of these
assumptions were as follows:
a. Infinite line source Gaussian
model;
b. Average feedlot size of 8,000 head
assumed vs. 20,000-25,000 head actual average;
c. Average animal spacing of 150
ft2/head, which is higher than average for California
feedlots;
d. Square feedyard shape factor;
and
e. Erroneous coefficient in emission
rate equation.
Further details and analysis
are provided in Appendix A, along with an improved procedure for determining TSP
emission rate from available data and to determine PM10 emission rate
from TSP data.
4. Comparison of Emission Factors
Using a Line Source (TAMU Process) and ISC Dispersion Modeling
McGee (1997) used Industrial
Source Complex version 3 (ISC3) to back-calculate emission factors from cattle
feedyards using the average 24-hour TSP net concentrations reported by Sweeten
et al. (1988) for each of the three feedyards sampled (Table 5). He used meteorological data in his
modeling and assumed the yards were square with 150 ft2/hd. As a check to see if the above procedure
would yield similar emission factors, we calculated the emission factors using
the TAMU procedure (Appendix A), with the results shown in Table
4.
Note that the TSP emission
factors (Table 5) were the same (97 versus 103; 50 versus 48; etc.) regardless
of whether we use ISC3 or the TAMU procedure. It should also be noted that ISC3
utilizes small area sources with a subsequent integration over the area in the
calculation of downwind concentration whereas the TAMU procedure utilizes a very
simple line source algorithm. The
grand mean concentration of 412 Fg/m3 yielded a
TSP emission factor of 20 lbs/1000hd/d (PM10) (uncorrected for
rainfall events). It would seem
that the TAMU procedure could be used to determine emission factors for cattle
feedyards.
5. PM
Concentrations
One of the issues that was
not addressed above is what net, downwind, 24-hour PM10
concentrations would be expected from a dairy compared to a feedyard. If the
dairy cows were as active as cattle on feedyards, the spacing of 1000
ft2/head would reduce the area emission rate by 6.7 (1000
ft2/head/150 ft2/head). Another way of describing this is
that for an area of 1000 ft2, there would be an average of 6.7 cattle
on this area for each dairy cow. Hence, the emission rate should be reduced by a
factor of 6.7. Since the modeled
downwind, 24-hour, TSP concentration is directly proportional to emission rate
QL (see Appendix A, Equation 1), the resulting downwind, 24-hour, TSP
concentration for a dairy should be reduced by a factor of 6.7. Hence a net
downwind 24-hour, TSP concentration of 412 Fg/m3 would be 62
Fg/m3. The net
downwind 24-hour, PM10 concentration would be 16 Fg/m3
(0.25*62).
6. Recommendations for Correcting
Emission Factors
a. The use of AP-42 for permitting cattle feedyards is inappropriate for either the cattle feedyard or dairy industries. We recommend that an appropriate emission factor for the cattle feedyard industry is 15 lbs/1000 hd/d (PM10).
b. It is inappropriate to include the calves in the determination of the annual PM10 emission rate for the dairy industry. Only cows spend time on the manure pack with the potential to entrain PM into the air by their hooves striking the manure pack surface. Calves are kept separate on paved areas or pasture. Hence, only the cows should be used in the emissions inventory (tons/year) calculations.
c. Dairy cows are less active than cattle in feedyards, spend a portion of time each day on paved alleyways or in milking stalls, and the open lots are “scraped” (manure removed) relatively frequently. All of these factors suggest that the PM10 emission factor for dairies should be less than the emission factor for beef cattle in feedyards.
d. The recommended emission factor for dairies should be 4 lbs/1000hd/d (PM10), which is 27% of the 15 lbs/1000hd/d (PM10) we are recommending for beef cattle feedyards.
Human
Response and Health Effects
1. Confined Animals
High levels of odorous
compounds have reportedly reduced growth performance and increased
susceptibility to disease in pigs in confinement (Mackie et al,
1998).
MacVean et al. (1986) found
that, in feedlot cattle, incidence rates of pneumonia were greatest within 15
days of cattle arrival in the feedyard and also during autumn. The incidence of pneumonia in the 16 to
30 days on feed time frame was closely associated with the concentration of
particulates of 2.0 to 3.3 Fm in diameter as well as the
temperature range 10 to 15 days before the onset of the
disease.
Gates et al. (2000) found
that ammonia concentrations in broiler house air exceeded the poultry industry
guidelines of 30-50 ppm for dietary treatment involving conventional rations
with high crude protein content and for a medium crude protein treatment. Birds challenged by exposure to high
levels of ammonia exhibit respiratory distress and increased incidence of
certain diseases. Ammonia
concentrations tend to be much higher in the boundary layer just above
litter/floor level at the intake height of the birds than at human workers’
height. Thus, excessive ammonia
levels to the birds may not be noticed by the workers.
2. Employee Concerns
The air quality associated
with confined animal feeding operations (CAFOs) may have an impact on human
health. Considerable research has
been reported on health effects on workers in confined swine operations where
workers are indoors working with the animals. Poultry workers are affected by poor air
quality also.
Von Essen and Donham (1999)
reviewed published literature on health effects experienced by those who work in
confined swine and poultry operations.
Exposure of normal volunteers to the swine confinement environment has
been shown to cause cough, dyspnea, nasal stuffiness, headache, fever, chills,
nausea and eye irritation. The term
asthma-like syndrome has been used to describe the cough, chest tightness,
dyspnea, and wheezing which are commonly seen in animal confinement
workers. Symptoms occur in
approximately 25% of these workers.
Chronic bronchitis is a common complaint among swine confinement
workers. Approximately 25% complain
of cough and sputum production characteristic of bronchitis. Episodes of organic dust toxic syndrome
have been reported in up to 34% of hog farmers. Eye and throat irritation has
been reported as well.
3. Affected
Public
The health effects of CAFOs
are not limited to the indoor CAFO environment. Wing and Wolf (1999) reported to the
North Carolina Dept. of Health and Human Services on significant health effects
being experienced by those who live near swine CAFOs. Increased occurrences of
headaches, runny nose, sore throat, coughing, diarrhea, and burning eyes were
reported. The research conducted to
date shows that employees who work in the swine environment and nearby public
citizens experience health effects.
Current
Policy – Characterization & Assessment
1. Overview
Currently, there are no
federal guidelines that regulate and control odors in the environment (Mackie et
al., 1998). However, increasing
concerns about the impact of animal/livestock feeding operations on the
environment and on public health is spearheading action at the federal and state
level to develop environmental protections that address waste management and
odor. At the federal level, the
U.S. Environmental Protection Agency and the U.S. Department of Agriculture have
the authority to develop policies that apply to animal feeding operations in
every state. The implementation and
enforcement of national policies, however, are the responsibility of the
states. Aside from national
mandates, states are free to develop state-only programs as deemed necessary and
in the best interest of the state.
For instance, differences may arise from the pollutant(s) addressed, the
degree of public outcry and the political climate of the
state.
At the local level,
regulatory requirements impart financial and time management burdens on farmers.
For example, farmers must keep current with federal, state and local projects
and regulations. Other financial and time management burdens include:
§
Providing different types of
information to a number of different agencies.
§
Reconciling differences
between agencies;
§
Developing plans for formal
approval;
§
Implementing voluntary and
mandatory measures;
§
Keeping information and
plans updated; and,
§
Working to integrate and
coordinate requirements into single, multi-faceted farm
plans.
In short, new and existing
environmental and conservation requirements are driving forces of the
consolidation of farming operations. By integrating farm planning, farmers will
be better able to meet the overhead costs associated with regulatory
demands.
To date, the cost of
developing and implementing Comprehensive Nutrient Management Plans (CNMPs) has
not been quantified. Research is needed to evaluate the average cost per farm
unit to: (1) develop the initial nutrient plan; and, (2) maintain implementation
of the plan on an annual basis. Without the understanding of the costs imposed
by regulatory requirements, the agricultural sector can be seriously handicapped
in both international and domestic markets and in terms of its support of
voluntary stewardship programs and activities. The following sections provide a
description of federal, state and local policies relating to animal/livestock
feeding operations across the United States.
2. Federal Policies
It is the federal
government’s responsibility to establish minimum national technical and
regulatory standards for AFOs.
Currently, the EPA regulates AFOs primarily through the Clean Air Act,
the Clean Water Act, the Coastal Zone Act Reauthorization Amendments and the
Safe Drinking Water Act. Other
federal regulations, however, are beginning to receive more attention with
regard to their application to AFOs and CAFOs. For example, recent policy guidance has
focused on regulatory requirements included in the Clean Air Act, the
Comprehensive Environmental Response, Compensation and Liability Act (CERCLA)
and the Emergency Planning & Community Right-To-Know Act (EPCRA). The USDA provides programs through the
Farm Bill and other legislation to help AFOs meet performance standards through
voluntary, regulatory or incentive-based approaches. On issues related to AFOs, EPA and USDA
are working together to assist animal producers and the public to address
environmental and public health concerns.
Some of these joint efforts and other federal regulations are summarized
below:
a. Draft Unified National Strategy for Animal Feeding Operation
In February 1998 President
Clinton released a Clean Water Action Plan that, among other things, called for
the development of an USDA-EPA national strategy to minimize the water quality
and public health impacts of animal feeding operations. From this clean water initiative, a
Draft Unified National Strategy for Animal Feeding Operation was developed.
The goal of EPA/USDA’s AFO
Strategy is to encourage AFO owners to implement strategies that minimize water
pollution from confined animal feeding facilities and land application
processes. To meet this goal, AFOs are expected to develop and implement a
Comprehensive Nutrient Management Plan (CNMP). A CNMP includes a feed management
plan, a manure handling and storage plan, a land management and manure
application plan and record keeping requirements. For 95% of AFOs, a CNMP is
voluntary, but strongly encouraged. For the largest 5%, however, the Clean Water
Act requires AFOs to obtain discharge permits (USDA/EPA, 1998). As previously
mentioned, research is needed to evaluate the cost of CNMP requirements to
farmers.
b. National Pollutant Discharge
Elimination System
The federal Clean Water Act
provides general authority for water pollution control programs, including
several programs related to AFOs and CAFOs administered under the National
Pollution Discharge Elimination System (NPDES) program. The federal NPDES
program is administered by EPA or any state authorized by EPA to implement the
NPDES program. Currently, 43 states are authorized to administer the base NPDES
program (a base program includes the federal requirements applicable to AFOs and
CAFOs).[1] The NPDES program includes a permit
requirement regulating the discharge of pollutants from “point” or discreet
sources into the waters of the United States. Under the NPDES program, AFOs and CAFOs
are defined in 40 C.F.R. 122.23 and
Part 122, Appendix B. These regulations define an AFO as a facility that meets
the following criteria:
§
Animals have been, or will
be stabled or confined and fed or maintained for a total of 45 days or more in
any 12-month period; and,
§
Crops, vegetation, forage
growth, or post-harvest residues are not sustained in the normal growing season
over any portion of the lot or facility.[2]
Federal regulations define a
CAFO generally as an animal feeding operation that:
§
Confines more than 1,000
animal units[3];
or,
§
Confines between 301 to
1,000 animal units and discharges pollutants:
§
Into waters of the United
States through a man-made ditch, flushing system or similar man-made device;
or,
§
Directly into waters of the
United States that originate outside of and pass over, across or through the
facility or otherwise come into direct contact with the animals confined in the
operation.
According to federal
regulations, the EPA or the authorized regulatory agency can designate an AFO as
a CAFO based on a determination that an operation is a significant contributor
of water pollution. This determination takes a number of factors into account,
such as slope, vegetation and proximity to surface waters, based on an onsite
inspection by the permitting agency. The EPA, along with USDA, states, tribes
and other federal agencies will revise the NPDES permit program regulations
regarding CAFOs by December 2001.
c. Feedlot Effluent Limitation
Guidelines
In 1974 the EPA promulgated
the Effluent Limitation Guidelines for feedlots, including the following animal
sectors: beef and dairy cattle, swine, sheep, horses, broiler and layer
chickens, turkeys and ducks. This
guideline establishes a no discharge requirement for process wastewater,
including manure from feedlots. The EPA, along with USDA, states, tribes and
other federal agencies will review and revise the effluent limitation guidelines
for poultry, swine, beef, and dairy cattle by December 2001. According to EPA, the revised Effluent
Limitations Guidelines may require an estimated 5,800 to 20,000 CAFOs to obtain
permits as compared to only about 2,000 permits issued to date (GAO,
1999).
d. Total Maximum Daily Loads
When water quality
requirements are not attained, the Clean Water Act includes response actions
defined as Total Maximum Daily Loads (TMDLs). TMDL requirements are implemented
through the NPDES permitting program.
e. Clean Air
Act
The Clean Air Act
establishes a framework for the attainment and maintenance of air quality
standards. In general, the Clean Air Act has two basic elements: nationwide air
quality goals and individual state plans (State Implementation Plans) designed
to meet the national goals. The Clean Air Act includes primary and secondary
national ambient air quality standards (NAAQS) for six criteria pollutants:
carbon monoxide, particulate matter, sulfur dioxide, nitrogen dioxide, ozone and
lead (Table 3). The primary standards are health effect standards that are
designed to protect the health of the most susceptible individuals in the
population: the very young, the very old and those with respiratory problems.
The secondary standards are designed to protect public welfare or quality of
life. All of the air quality standards are expressed as concentration and
duration of exposure. Many of the standards address both short- and long-term
exposure.
f.
CERCLA
The Comprehensive Emergency
Response, Compensation and Liability Act (CERCLA) or Superfund, was enacted by
Congress in December 1980, and amended by the Superfund Amendments and
Reauthorization Act in October 1986. In general, CERCLA creates a tax on the
chemical and petroleum industries and provides federal authority to respond
directly to releases or potential releases of hazardous substances that may
endanger public health or the environment. Historically, the fund has been used
to cleanup abandoned hazardous waste sites when no responsible party can be
identified. The concern in regard to CERCLA, is that it includes notification
and reporting requirements for the release of certain air emissions, (CERCLA
101(10)(H)) for hazardous air pollutants such as hydrogen sulfide, ammonia and a
number of volatile organic compounds commonly found in livestock manure. The EPA
is expected to announce new Interim Guidance on CERCLA and EPCRA reporting
requirements in August 2000. Public comment and final guidance will follow.
Heretofore, provisions
concerning the release of hazardous air pollutants (HAPs) have not been applied
to confined animal feeding operations as a matter of policy. “Federally-permitted releases” are
exempt from reporting and notification requirements of both CERCLA and
EPCRA. Nonexempt releases include:
(a) accidental releases; (b) start-up and shut down releases; (c) emissions
regulated only by ozone or PM standards; or (d) emissions from unpermitted or
unregulated sources as per the Clean Air Act Amendments. The current reportable quantity (RQ) for
both NH3 and H2S is 100 lbs/day, or 18.3 tons/year.
Recent EPA guidance (EPA,
1999) provides that releases from facilities that are specifically exempt from
CAAA permits or control regulations are not “federally-permitted releases” and
are not exempt from reporting requirements under CERCLA. This is a controversial
interpretation. Issues for CAFOs
include: (a) paucity of data; (b) whether standard practices for application of
manure or wastewater (spreading or irrigation) are included in the exemption of
“normal application of fertilizer;” and (c) whether CAFOs would be able to
qualify for some relief from reporting burdens through substantiating their
emissions constitute a “continuous and stable releases.”
g. EPCRA
The Emergency Planning and Community Right-to-Know Act (EPCRA) is Title III part of the Superfund Amendments and Reauthorization Act of 1986. EPCRA Section 304 requires notification of hazardous air pollution emissions to EPA’s National Response Center and state and local emergency planning entities when releases are greater than a set “Reportable Quantity”. The Reportable Quantity of hazardous pollutants are reported in units of mass that range from one (1) pound to 5,000 pounds, depending on the pollutant. Both CERCLA and EPCRA require sources to report releases deemed to be a “continuous and stable release” of hazardous pollutants above the Reportable Quantity. CAFOs have never been aware that they are subject to the CERCLA and EPCRA reporting requirements. There is concern that the recent EPA Interim Guidance may broaden their interpretation of the regulations to include CAFOs under the continuous and stable release requirements.
h. Summary of EPA Efforts by
Region
EPA Region
1 -- Connecticut,
Maine, Massachusetts, New Hampshire, Rhode Island and
Vermont
Relatively few AFOs are
located in the New England region.
To date, issues involving AFOs have been addressed at the state and local
levels. Water quality impairment
associated with CAFOs located in Massachusetts and Maine, however, are a growing
concern to the region. Region 1 has
committed approximately 10% of one (1) person’s time to coordinate AFO/CAFO
issues in the region.
EPA Region
2 -- New Jersey, New
York, Puerto Rico and the U.S. Virgin Islands
Region 2 is developing a
regional AFO/CAFO program including a permit program for CAFOs in Puerto Rico.
EPA Region 3 -- Delaware, Maryland, Pennsylvania, Virginia, West Virginia and Washington D.C.
The primary AFO issues in
Region 3 are related to poultry and hog facilities. To date, efforts in Region 3 have
focused on inspections and public outreach. Region 3 has committed 3.0 FTEs to
CAFO/AFO issues.
EPA Region
4 -- Alabama, Florida,
Georgia, Kentucky, Mississippi, North Carolina, South Carolina and
Tennessee
Region 4 is developing a
strategy to address AFOs. It is anticipated that the strategy will incorporate
both the objectives of the Clean Water Act and components of the USDA/EPA Joint
Strategy for AFOs. The region has
developed an enforcement strategy that relies on state referral of cases,
citizen complaints and the review of state regulatory files. The Region has assigned 4 FTE to
AFO/CAFO issues, including 1.5 FTE for program coordination and permitting and
2.5 FTE for enforcement.
EPA Region
5 -- Illinois,
Indiana, Michigan, Minnesota, Ohio and Wisconsin
Regional efforts focus on
evaluating and developing state programs, advising producers of NPDES
requirements and conducting inspections.
Region 5 has dedicated 0.5 FTE for permitting and 0.5 FTE for enforcement
and compliance assurance.
EPA Region
6 -- Arkansas,
Louisiana, New Mexico, Oklahoma and Texas
Region 6 enacted a CAFO
general permit in 1993 that requires a pollution prevention plan and adoption of
best management practices that address: manure and wastewater management,
nutrient management, and groundwater protection. It does not directly address air quality
issues. Region 6 developed a
multimedia AFO workgroup to discuss common issues and respond to requests for
information. Region 6 also adopted
a Cumulative Risk Index Assessment (CRIA) model that indirectly addresses
potential impacts of CAFOs within a designated watershed or airshed. Region 6 has committed 2 FTE to general
CAFO activities and 0.75 FTE for permitting and 2 FTE for
enforcement.
EPA Region
7 -- Iowa, Kansas,
Missouri and Nebraska
Region 7 is very active in
addressing AFO/CAFO issues. All
four Region 7 states have strong CAFO programs dating back to the early
1970s. Because these states have
strong programs in place, Region 7 has not independently pursued regulatory
activities related to CAFOs in the region until taking an enforcement action in
April, 2000 against seven commercial swine operations owned by a corporate swine
operation in Missouri. This Notice
of Violation (NOV) is for air pollution violations of the Clean Air Act and the
Missouri State Implementation Plan.
In general, the enforcement action addresses violations of
pre-construction and operating permit requirements and for air pollution
emissions greater than de minimis levels (PM10 and H2S)
included in Missouri’s SIP. Region
7 devotes approximately 1 FTE to AFO/CAFO activities.
EPA Region
8 -- Colorado,
Montana, North Dakota, South Dakota, Utah and Wyoming
In Region 8, the states are
responsible for issuing permits, conducting inspections and carrying out
enforcement actions under the NPDES program. Region 8 only gets involved after
receiving a specific complaint.
EPA Region
9 -- Arizona,
California, Hawaii, Nevada and other territories of American Samoa and
Guam
Region 9 is working with
these states to develop and implement state-specific strategies for animal
feedlots. Region 9 has an active
outreach, inspection and enforcement program. 3.0 FTE are devoted to enforcement
and compliance assistance and 0.3 FTE for permitting.
EPA Region
10 -- Alaska, Idaho,
Oregon and Washington
Region 10 has adopted a
watershed approach with a focus on water quality impairment, to address AFO
issues. Region 10’s program
consists of three components: (1) permitting, (2) inspections and (3)
enforcement. Six (6) FTEs are
devoted to AFO/CAFO issues in Region 10.
3. Recent State Policy
Developments
State and local governments often have the responsibility of implementing federal programs. For example, 42 states and the Virgin Islands are authorized to implement the NPDES permit provisions of the Clean Water Act (USDA/EPA, 1998)
State programs and AFO requirements vary from state-to-state. Listed below is a summary of some of the notable activities relating to AFOs at the state level:
Alabama
In 1998, Alabama
developed a Memorandum of Agreement outlining the responsibilities of state and
federal regulatory agencies as they relate to AFOs and CAFOs. In general,
Alabama administers an AFO/CAFO program that requires proper management of waste
collection, storage, transport, disposal, land application and siting buffers.
Currently, the state is considering moving toward a phosphorous standard that
would be based on NRCS standards and guidelines to determine appropriate
agronomic rates. Water quality is regulated through a state administered NPDES
program.
Alaska
The
state of Alaska does not have an EPA authorized NPDES program. Federal CAFO
rules apply.
Arkansas
In 1990 Arkansas implemented a short moratorium on construction of new hog confinements. Two years later, Arkansas passed Regulation 5, the state’s primary guidance for regulating large hog operations. Regulation 5 requires all confined animal waste facilities that use liquid waste handling systems to obtain a state permit. For new facilities, permit applicants must publish a notice in a county newspaper describing the type of facility to be constructed, the type of waste to be generated, the waste handling treatment to be used and a legal description of the property. Anyone who objects to the facility is provided the opportunity to lodge a formal objection notice with the Arkansas Department of Pollution Control.
In general, Regulation 5
prohibits the land application of animal waste when soil is saturated, frozen,
covered with ice or snow, or when significant precipitation is expected within
24 hours. The rule also prohibits
the application of manure on land with a slope greater than 15% and within 100
feet of streams, 50 feet of property lines, or within 500 feet of neighboring
buildings. A waste management plan
that describes application rates for manure and contains an annual report must
be submitted to the Department of Pollution Control by all permitted
facilities. Issues associated with
air quality, odor in particular, are not addressed by Regulation 5. In addition to Regulation 5, all
managing owners and operators of a facility must complete a waste management and
odor control training program.
The Arkansas Department of Environmental Quality has issued permits for AFOs since 1970 under the authorities contained in the Arkansas Water and Air Pollution Control Act. Arkansas also sets minimum standards for liquid waste management systems and for land application of animal waste.
Arizona
Arizona is not authorized to administer a NPDES permit program. General permits for CAFOs are issued by EPA Region 9. The Arizona Department of Environmental Quality administers a voluntary non-point source program to minimize the impacts of CAFOs on surface and ground water. Air regulations are applied according to the federal Clean Air Act.
California
California issues general CAFO NPDES permits. Permits for storm water runoff discharges maybe required prior to construction of new CAFOs. The state of California is working with EPA Region 9 to develop a statewide strategy to address animal waste.
California has permit programs regulating the activities of confined animal facilities. California has their “Porter Cologne Water Quality Act,” regulating the activities of discharges and implements the National Pollutant Discharge elimination System (NPDES). The regulations establish construction standards, monitoring standards, establish standard for unauthorized release, and reporting.
The State legislature established the Water Resources Control Board (SWRCB) to administer the regulatory programs. The SWRCB to provide comprehensive protection for California’s waters. The Regional Water Quality Control Boards issue discharge permits for all confined animal facilities.
Also, there is a piece of legislation unique to California, the California Environmental Quality Act (CEQA), which allows for public participation in the permitting process. Results of CEQA have been the establishment of standards more stringent than Federal regulations for the mitigation of air and water discharges from agricultural operations.
Colorado
Prior to 1999, Colorado did
not regulate agricultural operations.
In November 1998, Colorado voters overwhelmingly approved (by 64%) an
amendment to the Colorado Revised Statutes pertaining to odor and water
quality. Specifically, Amendment 14
requires the state air and water quality commissions to regulate housed
commercial swine feeding operations.
In terms of air quality, the purpose of the regulations is to minimize
odorous emissions from all aspects of swine operations that are capable of
housing over 800,000 pounds of swine at any one time (Colorado Regulation No.
2). In general, the regulation
requires facilities to obtain a permit to operate, to install covers on all
anaerobic lagoons, to adhere to mandated setback requirements and land
application bans and to minimize odor in swine confinement structures through
the implementation of odor control technologies and work
practices.
In Colorado, permits are not required or issued, but CAFOs are required to operate as no discharge facilities under a self-implemented NPDES regulation. AFOs not defined as CAFOs need to meet BMPs prescribed by the Colorado Water Quality Control Commission. New, reconstructed or expanded CAFOs must submit a Manure Process Wastewater Management Plan to the state.
In
April 2000, Colorado adopted legislation strengthening Colorado's "Right to
Farm" law. The new law boosts the
"First In Time - First In Right" standard for agriculture. Under this new legislation, the
agricultural operation cannot be deemed a public or private nuisance if the
operation was in existence prior to the development around it.
Connecticut
Connecticut AFOs are exempt from air quality regulations if they are following BMPs. Any activity on wetlands falls under state/federal regulations. Connecticut does not use the federal animal unit thresholds, but regulates on a case-by-case basis.
Delaware
CAFOs must follow state and federal regulations regarding air quality. Delaware uses voluntary programs to encourage the use of BMPs in regard to manure management.
Florida
The state of Florida administers a CAFO rule that follows the federal regulations. State permits require zero discharge and construction and operation permits are required. Permits are required for dry system poultry operations and some liquid manure systems. CAFO determinations for facilities with 1,000 or fewer animals units are made on a case-by-case basis.
Georgia
Georgia mandates a “bad actor” bill that allows EPA to deny permits to operators with poor compliance records in or out of the state. AFOs in Georgia are required to be no-discharge systems and NPDES permits are not issued. A voluntary program encourages the agricultural community to practice voluntary pollution prevention.
Hawaii
Oversight of CAFO issues is based on a complaint driven process. A guidance policy for livestock waste management addresses wastewater concerns related to CAFOs.
Idaho
The Idaho Department of Environmental Quality reviews all plans for new or modified waste treatment disposal facilities before construction. Dairies, in particular, are regulated by the Idaho Department of Agriculture through pollution prevention MOU and Wastewater Management Guidelines. AFOs that fall under the federal CAFO regulations are covered by a general NPDES permit issues by EPA Region 10. In general, the rules are designed to protect water quality through the abatement of water pollution from agricultural sources through the use of Best Management Practices.
Illinois
Since 1979, the Illinois EPA
has operated a livestock waste management program that provides for inspection
of livestock facilities throughout the state. In 1996, citizen groups pushed for
tighter rules for all new hog production facilities through the development and
approval of a site development report.
Although the citizen group bill did not pass, a Livestock Management
Facilities Act was adopted in 1996.
The Act was revised in 1998 to include rules pertaining to livestock
animal management.
The Livestock Management
Facilities Act and associated rules require owners of new lagoons to show
evidence of financial responsibility in case of closure of the lagoon. In addition, all operations over 7,000
animal units (about 17,500 full-grown hogs or 233,333 feeder pigs) are required
to prepare and submit a manure management plan to the Illinois Department of
Agriculture. Other requirements
include a setback distance of one mile between an operation of 7,000 animal
units and a populated area, or 2 mile between an operation
and a residence. Operations between
2,400 and 17,500 hogs would have to maintain, but not submit, a general waste
management plan. All operators of over 1,000 animal units must attend a training
session and pass a written test in manure management.
Indiana
The Indiana Confined Feeding
Control Law requires CAFOs to receive approval from the Indiana Department of
Environmental Management of plans for waste treatment facilities. CAFOs must
also follow water quality regulations. No air quality or other environmental
regulations address CAFOs.
Iowa
The Iowa Department of Natural Resources implemented a livestock-permitting program in 1972. Then, in 1978, the Iowa NPDES program was implemented. The discharge of manure directly into state waters is prohibited by Iowa’s Livestock Regulation Act – “manure law” that was adopted in 1995. More recently, the Department of Natural Resources proposed rules requiring producers to inject manure rather than spread it, and to prohibit the application of manure on frozen or snow-covered ground. The rules would also expand the number of operations who need to obtain permits.
Kansas
The Kansas Department of Health and Environment has regulated feedlots since 1968. Historically, regulations have focused only on large cattle feeding operations. In 1994, however, the Kansas legislature passed a law requiring operations over 300 animal units to register with the state and to establish a setback distance of 4,000 feet between an operation over 1,000 animal units and a residence. Then, in April 1998, the state legislature passed a new swine facility environmental regulation package. Regulations are currently being developed.
Kentucky
In 1980 Kentucky enacted
legislation to deal with nuisance actions and the ability of local governments
to abate agricultural nuisances.
The intent of this legislation was to protect existing farms from being
pushed out of existence from growing suburban areas. The scope of this legislation was
expanded in 1996 to include protections against legal actions against
agricultural operations.
Kentucky has a Swine Waste Management Permit program that requires all new swine feeding operations and existing operations that increase capacity to more than 1,000 animal units to obtain a permit.
Louisiana
CAFOs in Louisiana are issued individual permits under a state authorized NPDES program administered by the Louisiana Department of Environmental Quality.
Maine
No large AFOs exist in Maine and no CAFO permits have ever been issued. Currently, however, Maine is developing legislation to define CAFOs and to establish regulatory requirements for CAFO facilities.
Maryland
The Maryland legislature passed a Water Quality Improvement Act in 1998 that mandates nutrient management for all Maryland farms. A cost share program helps farmers meet installation costs for BMPs to protect water quality. Maryland is authorized to administer the NPDES program and has completed a draft general NPDES permit for CAFOs that is being reviewed by EPA Region 3.
Massachusetts
There are no large CAFOs in Massachusetts. The state, however, is authorized to administer a NPDES program and is working with EPA Region 1 to develop a permit template for CAFOs.
Michigan
Michigan has a Right-to-Farm Act that outlines Generally Accepted Agricultural Management Practices. This guidance document addresses siting of operations, designing waste disposal systems and the application of waste to agricultural lands.
Minnesota
Minnesota established a Feedlot Program in 1971 to address pollution from feedlots. The program is administered through the Minnesota Pollution Control Agency and the Water Quality Division. State permits are issued in one of three forms: Certificates of Compliance; Interim Permits; or Five-year Feedlot Permits.
In 1997 the Minnesota
legislature adopted a law requiring the Minnesota Pollution Control Agency to
establish a state hydrogen sulfide standard. The standard for hydrogen sulfide is a
30-minute average of 30 parts per billion (ppb) twice in five days or a
30-minute average of 50 ppb twice a year. In addition, the law includes funds
for monitoring emissions around the lagoons. Farmers were recently granted a 17-day
grace period each year to agitate manure storages for manure
application.
The Minnesota Pollution
Control Agency is in the process of amending its animal feedlot rules. If successful, feedlots would be
required to obtain a series of general permits, all addressing slightly
different circumstances.
Missouri
In 1995 and 1996, Missouri experienced numerous manure spills that prompted the state to place a temporary moratorium on granting permits to corporate hog operations. Shortly thereafter, the Missouri legislature adopted a law requiring operators to conduct facility inspections twice a day on hog barns, sewage pipes and lagoons. The legislation also established a setback requirement for animal units of over 1,000 in number of 1,000 feet. An operation of over 7,000 animal units must be 3,000 feet from a residence. In addition, a new operation is required to notify adjoining property owners of proposed construction plans.
Currently, the Missouri
Department of Natural Resources, Air Pollution Control Program lacks regulatory
authority over AFOs because air quality regulations pertaining to odor are
exempt from Missouri laws. In 1997,
however, the Missouri Attorney General issued a petition to the Missouri Air
Conservation Commission to amend the Missouri’s odor rule by removing the odor
exemption. The Commission formed a
workgroup to address the odor issue.
The end result of the workgroup was to develop rule language, although a
formal rule was not agreed upon by the entire workgroup.
Missouri administers the NPDES permitting program through the use of a general permit process. In general, all CAFOs must receive a NPDES permit to be covered under Missouri’s general permit requirements. CAFOs are classified under four different classification schemes based on the number of animal units. The classification dictates the permit and/or BMP requirements.
Mississippi
In 1998, the Mississippi legislature issued a two-year moratorium on permits from CAFOs submitted after February 1998. All CAFOs are subject to the federal NPDES permitting requirements. CAFOs outside the federal definition must submit a wastewater treatment/disposal worksheet and have an on-site inspection to ensure compliance with siting criteria.
Montana
The state of Montana mirrors the federal NPDES program.
Nebraska
Nebraska began its livestock-permitting program in 1972. NPDES permitting began in 1974. In April 1998, new legislation was passed that requires the state to develop a permit fee system, financial assurance plans and a training program for land application of waste. The state is currently developing a general CAFO permit.
Nebraska law permits
counties to develop comprehensive plans and zoning ordinances that pertain to
agriculture. Public hearings are
being held statewide to determine what improvements are needed in state
environmental regulations to address animal feeding operations in the state.
Nebraska has a constitutional restriction on corporate
farming.
New Hampshire
There is only one CAFO in New Hampshire and no NPDES permits have been issued.
New Jersey
There are no CAFOs in New Jersey. The state does, however, have a state NPDES program and specific criteria for CAFOs.
New Mexico
New Mexico is not a NPDES delegated state. EPA Region 6 issues general permits to CAFOs in New Mexico. The state issues ground water discharge permits through the New Mexico Water Quality Act.
New York
New York regulates CAFOs under a state administered NPDES program. In 1996, the New York Department of Environmental Conservation formed a technical CAFO workgroup to examine legal, regulatory, policy, environmental and economic issues associated with CAFOs. The group developed a series of four options from a totally voluntary program to implementation of the EPA CAFO regulations. General CAFO permits are required under the EPA-type programs. The state has issued a “Guide to Agricultural Environmental Management in New York State” as guidance for the voluntary program.
North Carolina
In March 1997 North Carolina
adopted a two-year moratorium on all new construction of hog operations larger
than 200 head. North Carolina law
gives counties the authority to zone and regulate hog operations over 600,000
pounds of swine (about 4,000 finishing hogs) through a general permitting
process. A county is not permitted to exclude hog operations from a zoned area.
The law establishes a number
of setback requirements: 1,500 feet between an operation and a home; 2,500 feet
between an operation and a public area; 500 feet between an operation and a
property line; and 500 feet between an operation and a well (with some
exceptions allowed). In addition,
manure cannot be spread within 75 feet of a property line or waterway. The law does include citizen suit
provisions and notification requirements for new or modifications to
facilities.
With respect to other AFOs, the North Carolina Division of Water administers a waste management permitting system. Together with permit requirements, operators are required to complete mandatory training and receive certification. North Carolina also administers an Agriculture Cost Share Program for nonpoint source pollution control. This program pays farmers up to 75% of the average cost of implementing approved BMPs and provides technical assistance to landowners.
North Dakota
The North Dakota State Department of Health administers state regulations regarding CAFOs. Permits are required for all CAFOs that handle 200 or more animal units and all feeding operations located in a three-year flood plain that have 100 or more animal units. North Dakota defines CAFOs as (1) any livestock feeding handling or holding operation in an area not normally used for pasture or growing crops where livestock waste accumulates, or (2) where the space per animal is less than 600 square feet.
Since 1987 (as amended in
1990) North Dakota passed general regulations to address odorous air
contaminants. The restrictions on
odorous air contaminants are based on general provisions pertaining to the
discharge of objectionable odors in ambient air. Exemptions apply for land application
purposes and during spring turnover of anaerobic lagoons.
Ohio
The Ohio EPA administers the Animal Waste Pollution Abatement Program. The Ohio Department of Natural Resources permits livestock operations over 1,000 animal units. The Division of Soil and Water addresses operations smaller than 1,000 animal units. Several voluntary programs exist at the state and university (Ohio State University) level to help farmers address pollution problems. A general NPDES permit is administered by the state.
In 1996 the Ohio General
Assembly considered, but did not approve, legislation that would give townships
the authority to vote on whether a large livestock operation could be built in
the county. Other legislation has
been introduced, but not adopted.
In general, this legislation has recommended the establishment of a
permit system based on water quality testing for all large livestock management
facilities (25,000 hogs, 10,000 beef cattle and 1 million
chickens).
Oklahoma
Historically, only water
quality laws in Oklahoma placed restrictions on large animal feeding
operations. Under the water quality
rules, large operations must apply for an Oklahoma CAFO License. The law applies to cattle, swine, sheep,
horses and poultry by monitoring waste management
programs.
On September 1, 1997, a bill
passed the Oklahoma legislature requiring operations with over 5,000 head of
hogs to obtain a permit and provide detailed information about the operation and
its management. The law also
requires citizen notification within one-mile of a proposed operation, a
pollution prevention plan, a public hearing (optional), annual soil testing,
record keeping, and annual, unannounced inspections of operations. Setback requirements are required
depending on the size of the operation and whether it is located in the eastern
or western part of the state.
In 1998 a poultry bill
passed the legislature requiring poultry operations to register with the
state. In addition, the bill sets
waste management and soil testing requirements, et al.
Oregon
The Oregon Department of Environmental Quality began permitting CAFOs in early 1980. Since 1993, the state Department of Agriculture has run the program. Under Oregon’s law, farmers are required to obtain permits to construct, install, modify or operate CAFO wastewater containment or disposal systems. CAFOs are exempt by state law from air quality regulations.
Pennsylvania
Pennsylvania regulates CAFOs through state water quality and nutrient management regulations. CAFOs are exempt from air quality regulations. The state administers its own NPDES program, but has not issued any general or individual permits to date.
Rhode Island
Rhode Island uses a watershed-based approach to regulate CAFOs. Pollution problems are addressed on a case-by-case basis.
South Carolina
South Carolina has been
regulating AFOs since the mid-1960s. Permits are required for the discharge of
pollution to surface or ground water. In 1996, the South Carolina Confined Swine
Feeding Operations Act was adopted.
The regulations apply to operations exceeding 3,000 head of hogs and
establish setback requirements for lagoons between waterways and neighboring
residence. Nuisance odors are also
included in the rules. In addition,
the regulations include specifications for the construction of lagoons and the
land application of manure.
The state is authorized to administer a NPDES program utilizing either a general or individual permit system. Waste management plans are required by law, and any discharge of effluent to surface water is a violation of state law, except in cases of natural disasters or social upheaval.
South Dakota
In 1997, the South Dakota legislature passed legislation that requires additional permitting requirements for new CAFOs constructed over shallow aquifers. This legislation requires CAFOs to pay an annual fee to cover regulatory costs. It requires the Department of Natural Resources to develop an inspection and enforcement program, and it provides the state with the authority to deny permit applications for “bad actors”.
In 1998, the citizens of South Dakota placed a constitutional amendment on the ballot to ban all corporate farming by non-family farmers. This action kept some large corporations from moving into the state. Basically, this legislation allows the state to hold negligent livestock owners liable for environmental pollution and establish an environmental cleanup fund for spill and releases from AFOs.
In South Dakota, counties have the authority to regulate the siting of agricultural operations. The state has adopted a general permit requirement for hog operations over 1,000 animal units. Under the general permit, facilities have to conduct annual soil tests; apply stored manure within 270 days; publish a notice in the local newspaper of any pending permit applications; limit the spreading of manure on frozen ground; and, require operators to complete manure management training.
Tennessee
State law exempts agricultural practices from regulation, except for point source discharges from confined operations. Tennessee is authorized to administer a NDPES program and a general permit for CAFOs (301 to 1,000 animal units) has been developed. Larger CAFOs are required to get individual permits.
Texas
The Texas Natural Resources Conservation Commission (TNRCC) regulates wastes from CAFOs. Under state law, the Texas Water Code and the Texas Clean Air Act authorizes TNRCC to administer the CAFO program. These rules require all CAFO operators to collect, store and handle animal waste and control dust and odor.
TNRCC put together an Agricultural Team to help CAFOs implement BMPs for managing animal waste. The agency also manages a Dairy Outreach Program that includes animal waste management training.
In Texas, EPA Region 6 administers the NPDES program. In some instances, Texas can issue state permits-by-rule pertaining to air and water quality for CAFOs. Every CAFO, however, is required to submit a pollution prevention plan to address discharges to state waters.
CAFOs in Texas have been regulated under strong programs as a point source for water quality purposes since the early 1970s, first by individual permit then since 1987 under one or more versions of state regulations. In addition, USEPA Region 6 imposed a comprehensive general permit on CAFOs in 1993 that requires adoption of best management practices (BMPs) for water quality protection and a pollution prevention plan (PPP), which include some measures that can improve air quality in a corollary fashion. Upon EPA delegation of authority to issue NPDES permits in 1998, the Texas Pollutant Discharge Elimination System (TPDES) rules were adopted in July 1999 and require application of BMPs and PPPs for both water and air quality. For air quality protection, Texas requires an operating permit for CAFOs with more than 1,000 head of livestock or the equivalent. Fundamentally, for air quality protection, Texas operates under the public nuisance rule. A Right to Farm Act was enacted in 1991 as well, limiting private lawsuits filed more than one year after an operation has been in existence. Texas has no specific odor intensity criterion nor a preferred monitoring method. The current (1999) TNRCC Subchapter B NPDES regulations regarding CAFOs have a quarter-mile or a half-mile setback distance requirement, unless they have an odor management plan and depending on written permission from neighbors.
Texas also adopted a hydrogen sulfide rule that became effective in 1974. The H2S rule prohibits hydrogen sulfide emissions from a source or multiple contiguous sources from exceeding specific H2S levels averaged over a 30-minute sampling period. Net ground-level concentrations are not allowed to exceed 0.08 ppm H2S (80 ppb) if they affect residential, business, or commercial properties, nor 0.12 ppm H2S (120 ppb) if they affect other property uses, “such as industrial property, vacant tracts, and rangelands not normally occupied by people.” General industry compliance with these rules was determined by TNRCC monitoring in 1998 and 1999.
Utah
In Utah, CAFO permits are administered by two agencies: the Utah Department of Environmental Quality and the Utah Department of Agriculture and Food. While Utah administers a NPDES program, swine facilities are not subject to NPDES permits, unless a facility has a point source discharge to surface waters of the state.
Virginia
There are no air quality regulations affecting CAFOs. The Virginia Environmental Quality administers the NPDES program under the authority of the federal Clean Water Act. Virginia issues general and individual no-discharge permits to CAFOs that are 300 animal units or more. No NPDES permits have been issued to CAFOs to date.
Vermont
The Vermont Department of Agriculture is working with the Vermont Department of Environmental Conservation to develop a CAFO program based on federal CAFO requirements and new state legislation. At present, there are neither specific rules nor air quality regulations for CAFOs. To date, Vermont has not issued a NPDES permit.
Washington
The Washington Department of Ecology is responsible for regulation of CAFOs under the state Water Pollution Control Act. Dairies (larger than 300 animal units), in particular, are subject to regulatory requirements including permitting, nutrient and waste management planning.
West Virginia
CAFOs in West Virginia are subject to the federal NPDES permit program. Voluntary educational programs are used to address concerns with fertilizers and manure issues affecting groundwater.
Wisconsin
Wisconsin CAFOs have been regulated since 1984 by the Wisconsin Department of Natural Resources under the state’s NPDES program. Wisconsin law requires AFOs over 1,000 animal units to obtain a permit and file an animal waste management plan. Since 1995, about half of the state’s counties have animal waste storage ordinances, but recent proposals are trying to limit local authority.
Wyoming
The Wyoming Department of Environmental Quality regulates wastes from AFOs through the NPDES, water and wastewater and solid waste programs. In 1997 Wyoming adopted regulations applicable to facilities over 1,000 animal units. The law requires manure management plans to address both water and odors. Setback requirements of one mile between an operation and a residence, school or town, or ¼ mile between an operation and a domestic well or waterway are included in the regulations. The Wyoming Department of Environmental Quality is drafting and implementing the law.
The state of Wyoming has entered into a Memorandum of Understanding with USDA-NRCS to assist small AFOs with design and construction of whole-farm waste management systems. The plan developed in cooperation with NRCS can be accepted in lieu of a construction permit for waste treatment systems (USEPA, 1998). Individual permits are required for CAFOs larger than 1,000 animal units.
Current
Technologies to Address Odor Problems
1. Approaches: An
Overview
Many technologies for
control of odor and odorants from CAFOs have been developed over the last 3 or 4
decades. Some of these technologies
have been evaluated to the point of proof of efficacy, but most have not been
evaluated properly or systematically.
Moreover, development of odor control practices has largely been
approached as a single-technology that only partially addresses the issues. By contrast, the CAFO industry would be
better served, and the neighboring public better protected, by utilizing a more
holistic approach that takes into account (a) potential sources within a
CAFO/feeding systems; and (b) potential approaches and methods of odor/odorant
control that are applicable to that feeding system or source. Table 6 represents a matrix of potential
control approaches and the odor source or location, within CAFOs/feeding
facilities and their associated manure treatment/storage and land application
system (Sweeten, 2000c).
Technologies presently exist
to produce pigs with an acceptable degree of odor control (Miner, 1995). Larger operations generally have greater
odor potential. There are costs
associated with higher degrees of odor control; not all locations require the
same degree of odor control; and requirements may change over
time.
Specific measures have been
devised to reduce odor from livestock facilities (Miner, 1974, 1975b, and 1995;
Barth et al., 1984; ASAE, 1999a; Sweeten, 2000b; Sullivan et al., 1999). These measures generally fall under four
broad approaches: (1) ration manipulation, (2) improved manure collection and
treatment, (3) capture and treatment of odorous gases, and (4) enhanced
dispersion. These primary
approaches are discussed in the following sections:
2. Diet Effects on
Odors
Zhu et al. (1999) confirmed
through an extensive literature review that most odorous compounds in swine
manure are produced from processes involved in protein decomposition; and thus,
reducing the protein content in the manure should help reduce swine manure
odor. In recent years, ration
changes to alter protein composition or feed additives has received considerable
attention (Harrison, 2000). James
et al. (2000) determined a 28% reduction in ammonia emissions from dairy heifers
by feeding a reduced-nitrogen diet (9.5% crude protein) as compared to a normal
11.0 crude protein diet. Ammonia
volatilization was measured on in-vitro manure slurry samples, with 90% of the
total measured within the first 26 hours.
Ammonia volatilized represented 42% and 53% of the initial manure
nitrogen for heifers and calf experiments, respectively. Estimated daily NH3
volatilization (g/day) was clearly related to the daily nitrogen intake of
heifers (g).
Imbalances of the C:N ratio
in intestinal systems of pigs, or during anaerobic digestion will produce
increased levels of malodorous compounds and reduced efficiencies of nutrient
and energy utilization in the pig (Drochner, 1987). Many of the odorous compounds are
associated with amino acid degradation, resulting in ammonia (NH3),
amines, skatole, indole, p-cresol, aliphatic aldehydes, hydrogen sulfide
(H2S) and other sulfur-containing compounds. Regulating the sources, levels and
efficiency in utilization of specific carbohydrates, N and S compounds to
minimize amino acid degradation in the pig should reduce odors and improve the
environment for the pigs and humans working in the
facilities.
Results from a two-year
study showed a 28% reduction in NH3-N content and emissions from
fresh manure when feeding pigs 3 percentage units less crude protein diets
supplemented with essential synthetic amino acids (Sutton et al., 1997). Volatile fatty acid concentrations and
other organic compounds emitted in air were also reduced. Even greater reductions (by 58%) of
NH3 release and other odorous compounds were observed in
anaerobically stored manure from this trial. Adding 5% cellulose to the amino acid
supplemented low protein diet reduced NH3 emission 46% (67% on a dry
matter basis) from fresh manure.
The pH of fresh manure was reduced 1.5 units (from 8.0 to 6.5) with the
addition of cellulose and VFA's were higher in fresh manure contents (Sutton et
al., 1999). In a follow-up study
(Sutton et al., 1998), reducing the sulfur amino acids and crude protein (5%),
by adding essential amino acids to the diet reduced ammonia and odor emissions,
total VFA (by 57%) and total nitrogen excretions 45% in fresh manure. The pH of the urine was reduced 2.0
units which significantly reduced ammonia emissions. Ammonia emission was reduced by 48% in
anaerobically stored manure. In
addition, there was evidence that reducing the sulfur containing amino acids and
removing the sulfur trace mineral sources from the pigs diet reduced the sulfur
containing odors (dimethyl sulfide, dimethyl disulfide, dimethyl trisulfide,
carbon disulfide, etc.) by 63%.
Group feeding studies at Purdue University (Kendall et al., 1998) verified that reducing crude protein (CP) (4.5%) and supplementing the diets with synthetic amino acids can effectively reduce ammonia and odor emissions from confinement buildings. There were 40% reductions in aerial and pit ammonia concentrations with pigs fed a reduced crude protein diet (RCP). Along with this, there was a 40% lowering of aerial hydrogen sulfide concentrations and the odor dilution ratio decreased by 30% when pigs were fed the RCP diet. In another study (Kendall, et al., 1999), reducing the dietary CP (by 2.7%) and adding 10% soybean hulls to diets (RCPF) lowered aerial ammonia (by 41%), pit TN (by 23%), pit ammonia (by 29%), pit pH (by 0.3 units), and aerial hydrogen sulfide levels (by 26.5%). Animal performance (weight gain and feed efficiency) was the same between the control and low protein and fiber diet in male castrates, but female did not perform as well on the low protein and fiber diet. Carcass quality was similar for all pigs except for a reduced backfat in male castrates fed the RCPF diet compared to those fed the control diet.
Research in The Netherlands
showed a 40% reduction in ammonia emission with a 4% reduction in dietary crude
protein and additional ammonia reductions by limiting synthetic amino acids
(Achterstraat and Spoorenberg, 1997).
Non-starch polysaccharides in fibrous feed ingredients (dried sugar beet
pulp, soybean hulls, wheat bran) have been shown to enhance energy balances,
reduce nitrogen excretion in urine and pH of manure resulting in reduced ammonia
emissions (Canh et al., 1998). Of
the fiber sources studied, soybean hulls and sugarbeet pulp had the greatest
effects on reducing ammonia emissions.
The addition of high dietary
concentrations of copper to weaning and growing pigs has been shown to alter
microflora patterns in the feces Goihl (2000), giving rise to the theory that
subsequent odor of manure may be altered.
Copper sulfate serves an antibiotic function in pigs, and from 75-90 % of
the consumed copper is excreted.
Goihl (2000) cited experiments to determine the effects of dietary copper
concentration and source on odor characteristics of swine manure. Dietary copper
levels and sources fed to both nursery pigs and growing-finishing pigs were:
copper sulfate – 10 ppm (control), 66 and 225 ppm; and cupric citrate – 33, 66,
and 100 ppm. Odor was evaluated by 10 trained odor panelists who sniffed the
headspace of laboratory containers containing the treated manure samples. Panelists furnished qualitatively
ratings on 0-8 point scales of: odor intensity (none to maximal), irritation
intensity (none to maximal), and odor quality (extremely pleasant to extremely
unpleasant). Results of Experiment
I that included the antibiotic carbadox in all rations, showed that odor
intensity and irritation intensity both decreased significantly in manure from
nursery pigs fed 225 ppm copper sulfate and 66 or 100 ppm cupric citrate, as
compared to the control treatment (10 ppm copper sulfate). Likewise, in growing
pigs, treatments of 66 and 225 ppm copper sulfate and 66 and 100 ppm cupric
citrate significantly reduced odor and irritation intensity, and all treatments
improved odor quality over the controls diet. However, when the antibiotic carbadox
was removed from all rations in Experiment II, copper sulfate at higher levels
than the 10 ppm control (i.e., at 66 and 225 ppm) did not improve odor
intensity, but all three levels of cupric citrate did improve (reduce) odor
intensity. Odor quality was
improved by 225 ppm copper sulfate and by 33, 66, and 100 ppm cupric citrate,
but irritation intensity was not affected by any of the 5 experimental
treatments. In summary, 66 – 100 ppm cupric citrate was as effective as 225 ppm
copper sulfate in improving odor parameters in swine feces, and can be
considered a tool for odor management planning for swine. However, it should be cautioned that the
pork and poultry producers’ needs to feed high levels of copper (e.g., 250 ppm)
have decreased in the last few years as sanitation conditions have improved, and
ruminants do not tolerate high levels of copper in the diet which can lead to
copper toxicity in cattle or sheep at levels exceeding as little as 20-25 ppm
(Greene, 2000).
The reduction of substrates
for anaerobic activity is an approach to reducing odor emissions (Baidoo, 2000),
and includes various feeding strategies such as: reduced nitrogen intake, phase
feeding, repartitioning agents, improved animal genetics, and various feed
additives. Some of the feed
additives include: sugar beet pulp, soybean hulls, Jerusalem artichoke, zeolite,
and yucca extracts. Altering the dietary electrolyte balance resulting in
lowered pH may be a means or reducing ammonia emissions at
least.
3. Manure Treatment for Odor
Control
Manure treatment methods for
odor control include maintaining aerobic conditions during storage, aerobic
treatment (aerated lagoons or composting), anaerobic digestion or biochemical
treatment. Oosthoek and Kroodsma
(1990) noted a three-fold reduction in ammonia emission rate by flushing the
concrete floor in a free stall dairy barn, with minimal ammonia reduction from
scraping the concrete floor. Mackie
et al. (1998) summarized the work of other authors in reporting that as much as
75% of the nitrogen excreted by feedlot cattle and swine is volatized as
ammonia.
For open lot surfaces, rapid
drying is the key to odor control.
The same should be true for reducing ammonia emissions on a mass
basis. Frequent, uniform removal of
surface manure and excellent drainage in which manure is regularly harvested
leaving a smooth, uniformly sloped pen surface with interfacial layer intact to
maintain surface-sealing are also beneficial.
Wet manure on a feedlot or
dairy lot surface can be responsible for the generation of significant odor, in
terms of both odor concentration and offensiveness. Watts et al. (1994)
determined a 60-fold difference in measured odor concentration (in terms of odor
units measured with a dynamic forced-choice triangle olfactometer) between dry
and wet feedlot surfaces. Odors
were highest at mid-day. Odor
generation peaked at 2-3 days after rainfall and at a surface moisture content
of 60-67% (w.b.). Therefore,
feedlots with wet anaerobic manure accumulation will create odor of greater
concentration, offensiveness and duration than a well-drained and
well-maintained feedlot. Ration had
less effect on odor concentration than moisture content.
Well-drained feedlot
surfaces with relatively low quantities of manure dry rapidly after rainfall,
restoring odor intensities to original levels (Sweeten, 2000a). Feedpen maintenance and manure
collection strategies should be aimed at (a) avoiding chronic wet spots caused
by poor drainage, potholes, or spills of process generated water; (b) harvesting
only the top 1/2 to 2/3 of the feedlot manure; and (c) preserving an uncomposted
manure/soil interfacial layer for surface sealing and dentrification. This strategy will help reduce odor,
maintain reasonable manure quality as a fertilizer, and protect
groundwater.
A feedlot should be designed
and managed to shed water. Pen
slope of 3 to 5% away from feedbunks or feeding alleys is needed, with discrete
drainage provided for each feed pen into a drainage channel that accelerates
runoff away from the feedlot surfaces with minimal solids deposition. Potholes should be backfilled as soon as
they develop, and overflows or leaks from cattle watering facilities onto the
feedlot surface should be avoided.
Proper stocking density in pens can ensure that moisture excretion by
cattle plus rainfall does not exceed average evaporation in winter as well as
summer months.
Several studies have
investigated the use of chemical amendments to decrease ammonia emissions from
animal manures. Alum additions have
been shown to decrease ammonia emissions from poultry litter (Moore et al.,
1995) and beef cattle manure (Cole and Parker, 1999). Similarly, urease inhibitors have been
shown to decrease ammonia emissions from beef cattle manures in laboratories
(Mackie et al., 1998; Varel et al., 1999; Cole and Parker, 1999). Field studies are needed to corroborate
these promising trends. The effects
of these compounds on emissions of other potentially odorous gases have not been
thoroughly studied.
A laboratory study was
conducted to evaluate soil amendments for reducing ammonia emissions from
open-lot beef cattle feedyards (Shi et al., 1999). A mixture of 1,550 g of soil, 133 g of
manure, and 267 g of urine was placed into plastic containers (20 cm X 20 cm X
12 cm depth). Treatments with four
replicates consisted of a blank (soil with no manure), control (mixture with no
amendment), 4,500 kg/ha Al2 (SO4) 3 (alum),
9,000 kg/ha alum, 375 kg/ha commercial product (CP), 750 kg/ha CP, 4,500 kg/ha
CaCl2, 9,000 kg/ha CaCl2, 9,000 kg/ha brown humates, 9,000
kg/ha black humates, 1 kg/ha of the urease inhibitor N- (n-butyl) thiophosphoric
triamide (NBPT), and 2 kg/ha NBPT.
Ammonia emissions in air passed over the soil treatments were monitored
daily using a hydrochloric acid trap following application of the amendments.
Cumulative ammonia emissions after 21 days, expressed as a percentage of the
control were: 0.4% for the blank, 8.5% for 4,500 kg/ha alum, 1.7% for 9,000
kg/ha alum, 73.6% for 400 kg/ha CP, 68.2% for 750 kg/ha CP, 28.8% for 4,500
kg/ha CaCl2, 22.5% for 9,000 kg/ha CaCl2, 32.4% for 9,000
kg/ha brown humates, 39.8% for 9,000 kg/ha black humates, 35.9% for 1 kg/ha
NBPT, and 34.4% for 2 kg/ha NBPT.
Results of these experiments suggest that ammonia emissions from open
feedlots can be reduced using chemical additives. However, preliminary cost estimates
ranged from less than $1 to more than $33 per head of cattle fed, depending on
the product, application rate, and frequency of treatment (Ishmael, 2000). The amount and frequency of treatments,
cost-effectiveness, and environmental impacts from the chemical amendments have
not been adequately evaluated, and practical use in a commercial feedyard
setting have not been demonstrated.
U.S. swine operators have
adopted one of two predominant manure management strategies (Miner, 1995): (a)
slurry storage under the slotted feeding floor or outside storage tank, with
minimal dilution water; and (b) anaerobic lagoon, usually with ample dilution
water for hydraulic transport of manure solids. Slurry storage units are more compact,
have smaller surface area, and are more amenable to temporary or permanent
covers to capture and/or treat odorous gases. These systems tend to be favored in
northern states such as the upper Midwest and Northern Great Plains or where
terrain or geology does not favor construction of an earthen lagoon. Due partly to concerns with the effects
of gases emitted from under floor storage pits and their effects on animal
health and performance, there has been a major trend for at least two decades
toward frequent removal from building by mechanical scrapers or flushing
systems. Many products have been
marketed as digestive acids in pits or lagoons, with odor control or odorant
reduction touted as a benefit. The
National Pork Producers Council has established Purdue University as a
laboratory for performing standard tests of these products. For instance, Ni et al. (1999b) found a
24% lower NH3 emission per hog from spraying underfloor liquid manure
storage pits with one such product.
Lagoon systems are usually
accompanied by flushing for manure removal from the buildings generally with
recirculated lagoon effluent. It is
important to observe the distinction between a lagoon and a manure storage, as
defined by ASAE (1999c):
Lagoon: An earthen facility for the
biological treatment of wastewater.
It can be
aerobic,
artificially aerated, anaerobic or facultative depending on the loading
rate, design, and
type of organisms present.
Manure Storage: A storage facility to
contain manure for some period of time
prior to its
ultimate utilization or disposal.
Usually classified by type and form
of manure stored
and/or construction of the storage, e.g., above or below ground
liquid manure
tank, earthen storage basin, solid manure storage.
Lagoon systems have tended
to be adopted in the southern states and the southern portions of the Midwest
and Great Plains where reasonably warm water temperatures most of the year
promote treatment (biodegradation).
Proper lagoon design and management principles (ASAE, 1999b) are intended
to lessen odor intensities as well as achieve operational efficiencies. This includes designing and operating
the system for a low volatile solids loading rate. In addition to a properly sized primary
anaerobic lagoon, a lightly loaded second-stage lagoon is generally recommended
to provide further treatment, effluent storage, and effluent with low odor
potential for flushing and irrigation.
In cold climates, thermal stratification is pronounced, and spring
warming trends leading to inversions (destratification) tends to greatly
increase odor emissions for several weeks (Miner, 1995). Moreover, large operations necessitate
larger lagoons, with concomitant increases in odor-emitting surface area and
thence greater separation distance between the lagoon and neighbors to avoid an
odor problem.
Lagoons
for livestock manure and wastewater treatment are believed to be a necessity
until such time as superior and cost effective technology is widely available
(Sweeten, 2000c). These structures
have served the public well in terms of keeping enormous amounts of manure and
wastewater out of streams, and will continue to do so for another generation at
least. However they are a somewhat
limited technology. Problems with
lagoons that do need to be addressed have generally stemmed from human errors in
terms of over-optimism as to design, performance, ease of maintenance, perceived
flexibility, and public tolerance for off site impacts. More specifically, these problems
can/have included: (a) designing just to meet minimum state regulations for
controlling direct discharges into streams; (b) under-design; (c) excessive
organic loading, (d) inadequate sealing, (e) increased herd size or liveweight
with inadequate compensation for design and management; (f) usage at
inappropriate sites/locations; (g) frequent attempts to accomplish both
treatment and storage with one single stage lagoon vs. realizing benefits of
multi-stage lagoons; (h) insufficient sludge clean out interval or plan for
sludge removal/ utilization relative to life of the animal feeding system; (i)
regional differences in climate or geology that favor lagoons in certain
locations and not in others; (k) emissions ammonia volatilization, and (k) odor,
where the above are not adequately observed.
Cheng et al. (1999) observed
sequential decreases in odor from raw flushed swine wastewater, covered primary
lagoon effluent, and second stage lagoon effluent in terms of odor intensity and
irritation intensity. In essence,
on an 8-point rating scale, odor intensity was reduced from 6.75 (very strong)
from wastewater, to 5.1 (moderately strong) in primary lagoon effluent, to 1.6
(weak) in second stage lagoon effluent.
Comparable values for irritation intensity were 5.9 (strong), 3.75
(moderate), and 0.6 (very weak), respectively.
Lim
et al. (2000) used a buoyant convective flux chamber to sample odor from two
anaerobic lagoons in Illinois and Indiana.
Odor concentrations, expressed as odor detection threshold or odor units
(OU/m3), were determined with a dynamic triangle forced-choice
olfactometer (DTFCO). Other
parameters measured were H2S, NH3, and
CO2. Odor concentrations
averaged 82 and 144 OU/m3 for flux chamber inlet and outlet samples,
respectively, and average odor emission rate for both lagoons was 3.4
± 2.6
OU/m2/sec. Average
emission rates for NH3, H2S and CO2 were 98,000
Fg/m2/sec,
6.1 Fg/m2/sec,
and 1.0 Fg/m2/sec,
respectively.
Heber
and Ni (1999) determined that mechanical aeration with static tubes installed in
an overloaded anaerobic swine lagoon was very effective in reducing odor
emissions. Floating flux chambers
were used to capture lagoon surface air samples, which were analyzed by an odor
laboratory with a dynamic triangle forced-choice olfactometer at Purdue
University. Odor concentrations
measured as dilutions to threshold or odor units (OU) ranged from 89-123
OU/min/m2, and averaged 10 OU/min/m2 of lagoon surface
area, which indicated a total odor emission of 16,200 OU/second. These odor levels were 82% less than the
589 OU/min/m2 odor emissions measured at two nearby unaerated
anaerobic lagoons receiving half the volatile solids loading rate. Total farm odor emission was reduced by
70% with aeration.
4. Capture and Treatment of Odorous
Gases
This approach includes the
use of covered storage pits or lagoons; soil incorporation of applied liquid or
solid manure; and dry scrubbers for building exhaust gases, including soil
absorption beds, bio-filter fields, or packed beds. Soil injection or disking manure into
the soil after application reduced odor concentrations by 90 to 99% as compared
to surface spreading (Lindvall et al., 1974). Kelly (1995) listed 10 technologies for
controlling odor from mechanically ventilated confinement buildings (cattle,
swine, or poultry) or composting facilities. Hoff et al. (1997) have found that a
significant component of swine building odor is caused by odorous compounds that
are bound to dust particles, so particulate control methods are applicable as
well to odor control.
Soils and organic materials
such as peat or wood chips readily absorb odorous gases and provide for aerobic
decomposition of captured odorants.
Biofiltration has been used for more than 2 decades for odor reduction in
composting, rendering plants, solid waste processing and industrial sources
(Classen et al., 2000). Sweeten et
al. (1991) found that ammonia concentrations in exhaust air at 65-192 ppm
NH3 from a poultry manure composting operation were reduced by 97-99%
in air at 76 mm above a 230-250 mm deep fine gravel/sand biofilter field. The biofilter was used to treat exhaust
gases captured from the in-bin composting building during the first week of
composting. Classen et al. (2000)
demonstrated that a biofilter medium of yard waste compost and wood chips (3:1
ratio by volume) at a depth of 50 cm and 15 second residence time reduced odor
from pit-stored liquid swine manure.
An odor panel evaluation revealed that the biofilters reduced odor
intensity (60%), irritation intensity (58%), and unpleasantness (84%).
Safley and Westerman (1990)
demonstrated the use of a floating flexible membrane cover to capture and
collect biogas (including odorants) produced from a primary treatment lagoon for
a 150 cow free-stall dairy to fuel an internal combustion engine and electric
generator. Two types of lagoon
covers have been proposed: impervious (rubberized or plastic materials) and
floating permeable covers (fabric, crop residues, leka rock, etc.) (Miner,
1995).
Van Zeeland et al. (1999)
has determined that the most effective means of reducing ammonia emissions from
swine confinement buildings is to reduce the surface area of the emitting
surface of manure. Proposals to
expand the feeding area per head for swine may run counter to the goal of
reducing ammonia emissions. The
defecating area of weaned piglets in large groups is less than for smaller
groups of piglets. This has a
positive effect on pen fouling and reduces ammonia
emissions.
Verdoes and Zonderland
(1999) investigated a chemical scrubber as a means of reducing ammonia emissions
from swine growing/finishing houses.
The average ammonia concentration in the exhaust air was 10.87
mg/m3 before treatment and 0.13 mg/m3 after scrubber
treatment (98.7% reduction, with a range of reductions varying from
90.4-99.9%). Reduced ammonia
concentrations through the wet scrubber were measured 91 out of 100 days of
observation.
Clanton et al. (1999a) found
that six types of manure covers -- straw mat, vegetable oil mat, straw/oil mat,
clay ball mat, PVC/rubber membrane, and geotextile membrane -- all temporarily
reduced measured odor units (dynamic triangle forced-choice olfactometer) and
hydrogen sulfide concentrations in flux hoods over simulated liquid swine manure
storage tanks. Effectiveness varied
between treatments, and within treatments, with time after manure addition and
study initiation. Operating
problems included the tendency of straw mats to sink and the vegetable oil to
generate secondary odor. The straw
mat with vegetable oil and the PVC/rubber membrane cover appeared to be most
effective for reducing both odor and H2S. There was not a statistically
significant advantage to covers 48 hours after manure
additions.
Laboratory and pilot plant
experiments by Xue et al. (1999) determined that two thicknesses (5 cm and 10
cm) of wheat straw applied over anaerobic liquid dairy manure were effective in
reducing emission rates of ammonia by 60-95% and of hydrogen sulfide by up to
95% over a 7 week period. The wheat
straw cover formed a physical absorption barrier, and also provided a carbon
source for improved equilibrium digestion conditions of the surface manure. The process requires further testing for
long periods on field facilities.
Heber and Heyne (1999)
reported that property line concentrations of H2S, based on
continuous monitoring at a 14,600-head grow/finish swine operation, were twice
as high at night as during the daytime.
Modest reduction in H2S emission resulted from addition of a
bacterial product to a primary lagoon; greater than 50% reduction in property
line H2S concentration (to 4-10 ppb) resulted from ensuing partial
aeration for 41 days (after an initial increase the first week of aeration); and
placement of a geotextile/straw cover reduced H2S concentration
further to 0.2-2.8 ppb. The average
H2S concentration with the cover (5 weeks) was only 13% of the mean
concentrations before the cover was installed (previous 19
weeks).
Xue and Chen (1999) sprayed
0.5% solutions of chemical oxidants -- hydrogen peroxide or potassium
permanganate -- on the surface of anaerobically stored liquid dairy manure
flushed from concrete surfaces in a dairy facility. Chemical treatments were applied to
laboratory flasks at a depth of 0.2 cm (0.082 inches) at weekly intervals for
5-6 weeks. Ammonia concentrations
in the top one-inch (0.25 cm) were reduced by about one half and ammonia
emission rates were reduced by 70% compared to the control treatment, due to
lower pH as well as surface NH3 concentration. The potassium permanganate spray
treatment reduced ammonia emissions for 4 weeks but they returned to the control
levels by the end of the test. Both
chemical oxidants reduced hydrogen sulfide concentrations in the top one-inch
depth of liquid by 80% or more over 5 weeks, and H2S emission rates
were also lower. The hydrogen
peroxide treatment was highly effective in reacting with manure and reducing
odorous gas emissions and is recommended over potassium permanganate due to
lower cost, better performance, and absence of residue. Mass transfer coefficients for ammonia
were one order of magnitude higher than for hydrogen sulfide, but were not
affected significantly affected by surface chemical
oxidation.
Non-thermal plasma reactors
have been used to remove several types of air contaminants such as VOC’s,
hydrogen sulfide, and ammonia.
Electrical discharge can be implemented in several ways, depending on the
configuration (Zhang et al., 1996).
Goodrich et al. (1999) devised a laboratory scale dielectric barrier
discharge plasma system that removed 100% of the H2S and 87% of the
SO2 from a synthetic gas stream with three kinds of dielectric
materials.
Covered anaerobic lagoons,
serving as a psychrophilic anaerobic digesters, are capable of capturing
0.25-0.6 m3 methane per kg volatile solids loading rate (Cheng et
al., 1999).
5. Enhanced Dispersion of
Odor
Odor and other air
contaminants are diluted to below threshold levels by atmospheric turbulence,
which increases with wind velocity, solar radiation, and roughness elements such
as buildings, trees or barriers (Miner, 1995). Traditionally, extensive livestock
production systems dispersed the odor by having thousands of small farms
scattered over the terrain, so that no one farm generated sufficient odor to be
a major community problem. The most
intense odor occurs under nightly stable atmospheric conditions, known as
inversions. Means of
technologically dispersing the aggregate of the odor from the larger production
units may be needed in site-specific cases.
Sound site selection for
CAFOs with adequate separation distance and, if necessary, elevated sources or
mechanical turbulence will help achieve odor dispersion and avoid nuisance
conditions. Odorants may be
transformed between the source and the receptor, and this includes interactions
with other odorous gases or particulates (Peters and Blackwood, 1977). Ammonia and hydrogen sulfide are highly
reactive, have relatively high odor thresholds and low molecular weights and
disperse rapidly (i.e., low persistence factor) (Summer,
1971).
Sound site selection is the
simplest and cheapest odor control strategy (Kelly, 1995) that protects
investments in new concentrated animal feeding operations and surrounding real
estate and avoids exorbitant expense of legal actions involving odor
nuisance. To achieve good
dispersion, operators should choose a remote site relative to neighbors; gently
sloped topography without confining valley walls; and low probability of wind
direction toward nearby neighbors, coupled with stable atmospheric conditions
that retard dispersion.
Land application is a
frequent cause of odor complaints and can be minimized or eliminated by daily
site selection with regard to distance and wind direction frequency
considerations and by use of adequate treatment systems (as above) to produce a
well-stabilized wastewater or compost (Miner, 1995). Irrigation systems that produce low
visibility or spray drift (e.g., level borders, low pressure sprinklers, or
spray nozzles) will be less likely to trigger odor
complaints.
Most dispersion models are
based on the Gaussian plume dispersion equation, which is convenient but not
very reliable where topographic features are involved (Miner, 1995). Development and use of emerging
technology for modeling of odor dispersion requires knowledge of emission rates
(i.e., concentration times airflow rate) as a surrogate for mass emission rate
(Smith and Watts, 1994a; McFarland, 1995).
For instance, Smith and Watts (1994a) used dynamic forced-choice triangle
olfactometer measurement to calculate odor emission rates ranging from 5 OUm/s
for a dry feedlot pad to over 500 OUm/s for a wet feedlot pad, and these data
were used to model dispersion.
Modeling will be used in the future to predict odor impacts on
surrounding land users more accurately in advance, before projects (agricultural
or non-agricultural) are actually built.
However, much more research is needed before accurate odor models are
developed, calibrated, and utilized with accuracy. The non-linear/non-additive nature of
odor emissions from contributing sources makes it difficult to predict odor
emission rates from complex sources, such as feedlots and dairies (Kelly,
1995).
Miner (1975a) observed that
odor concentrations as determined with the Scentometer and ammonia
concentrations diminished rapidly with distance downwind of a cattle
feedlot. Effective measurements of
ammonia concentrations were possible only up to 200 m downwind from the feedlot,
because of the low levels of ammonia evolved at the source and dilution from the
wind. Ammonia concentrations were
reduced by 82 to 96% within 120 m (400 feet) from the
corrals.
One means of insuring
substantial buffer distance between a confinement swine operation and off-site
residences is to balance the amount of land with nutrient needs of crops or
forages (Sweeten, 1998). In many
cases, this land area, determined perhaps through a CNMP, may be large enough to
ensure an adequate buffer distance for odor control. There is often a tendency to
underestimate land area requirements through the use of optimistic or
unrealistic estimates of nutrient “losses” (e.g., high rates of ammonia
volatilization, sediment in lagoons, etc.) or nutrient recovery by crops. Where nutrients are not properly
accounted for, both water and air quality are at greater risk, along with
lessened opportunities for economical nutrient recovery. Design aids and management tools are
available to guide the producer toward providing and maintaining adequate land
area for manure and wastewater application. Standard values for manure and nutrient
production are provided in ASAE standard values (ASAE, 1997) based on animal
liveweight. These values are used
in various spreadsheets that can be used to estimate total nitrogen and
phosphorus production, size of treatment or storage facilities, approximate
nutrient losses and nutrient uptake by crops (Baird, 1993; Schulte et al., 1994;
Sweeten et al., 1993).
Sweeten (1998) developed
examples of determining phosphorus and nitrogen balances, the resulting
theoretical minimum separation distances, results of field odor concentration
measurements at two swine operations, and required distances to reach
near-background odor levels. He
determined that for swine confinement facilities, larger acreages will be needed
to provide a phosphorus balance than for an N balance, which may be an advantage
for odor control. Odor diminished
generally with distance downwind and for both farms, odor concentration
(dilutions to threshold, DT) was found to be related to downwind distance
(c, feet) through logarithmic
relationships.
An odor concentration of 2
DT was found to be consistent with background odor levels (Sweeten, 1998). It is regarded as a low odor strength
and a level that does not cause odor nuisance conditions (Barnebey-Cheney,
1987), and is also a level that has been used as a property line standard in
several jurisdictions (Sweeten, 1990).
Accordingly, the odor vs. distance regression relationships indicated
that a distance of 790 m (2,600 ft) from the odor source resulted in 2 DT at the
200-sow farm using a scrape, storage pit, soil injection system. A greater distance -- 2,300 m (7,580 ft)
-- was required for the larger operation (8,400 sow operation) to achieve 2 DT,
using a flush/lagoon/sprinkler irrigation system. From the data presented, for both
Systems A and B, distances required for odor control may exceed the minimum
indicated for N balance, but less than needed for P balance considering complete
P recovery from lagoons or other treatment/storage limits over the life of the
systems.
It is important that the
site selection and design be based on information that will result in adequate
separation distance with respect to odor nuisance protection and also site
sustainability from the standpoint of protection of soil and water quality
(Sweeten, 1998). These objectives
can be met by selecting the greater of the two distances -- odor reduction vs.
nutrient management objectives.
Alternatives to providing the necessary distances might be to redesign
the manure and wastewater management system to reduce odor concentration at the
source or improve opportunity for odor dispersion. Otherwise, choosing an alternative
location or downsizing the operation should be considered.
6. Summary of Odor Control
Opportunities
Odor control is of
increasing concern and in the immediate future, application of those
technologies available will be required to a greater extent (Miner, 1995). Aerobic systems and enclosed anaerobic
storage/treatment of manure have obvious application. The use of enclosed manure storages and
direct soil injection is possible in many more locations than is now
practiced. Of paramount importance
to the success of present day systems is to avoid overly optimistic assumptions
in assessing manure production and treatment efficiencies in the design of
storage, treatment, and land disposal systems. Overly optimistic design assumptions in
these areas have frequently been utilized to justify placing an operation on a
particular parcel of land that is too small. These short term expediencies result in
operations that are more likely to lead to odor conflicts or environmentally
unsustainable systems from a nutrient management perspective. Cost saving measures in site selection
and facility design can lead to higher cost, including expensive retrofits and
neighborhood conflicts in later years.
Candidate
Dust (PM) Control Practices
Feedlot dust is generated by
cattle activity, which has peak activity in early evening hours. MacVean et al. (1986) linked the health
and performance of feedlot cattle to episodes of feedlot dust. Table 7 provides a matrix of particulate
matter control approaches for either confinement buildings or open lot feeding
systems, as well as solid manure storage and land application (Auvermann,
2000). The primary predictor of
dust and odor emissions is the manure moisture content. There are conceptual tradeoffs between
feedlot odor and dust. An optimum
moisture content appears to be between 25-40% wet basis (Sweeten et al.,
1988).
Feedlot dust control
approaches include: stocking density adjustment (taking advantage of manure
moisture excretion); frequent manure collection; and water application via
mobile equipment or sprinkler irrigation.
Water requirements for dust control can approach cattle drinking water
requirements in dry seasons; a typical guideline is 2.5-6.0 mm/day (0.1-0.25
in/day). Future research will
incorporate on-site climatic monitoring and surface drying models for
application of dust control measures.
Romanillos and Auvermann (1999) conducted 16 feedlot PM sampling events
at a 60,000 head commercial feedlot in the Texas Panhandle to determine whether
stocking density at 13.9 m2/hd vs. 7.0 m2/hd, with
associated increases in excreted moisture per unit area, affected dust
concentrations. After 8 months of
test results, the higher stocking density (i.e., reduced spacing) resulted in
measurable reductions in PM concentrations, although data analysis is still
being conducted.
Original USEPA estimates of
so called “emission factors” for feedlot dust were excessive (based on dry
season southern California conditions), and improved emission factors are being
developed to include recent research at Southern Great Plains
feedyards.
Current
Research Programs to Address Problems
1. General Characterization of Prior
Research
There
is a considerable amount of research supported by a diverse group of private,
state, and/or federal agencies addressing air quality and confined animal
feeding operations and its effect on human health. Biological Abstracts from 1985 to the
present of air quality studies listed 1,240 entries from around the world. Narrowing the search to air quality and
animals yielded 426 entries of which the vast majority dealt with human
health-related issues. However, a
study by Clausnitzer and Singer (1996) attempted to quantify respirable-dust
production from agricultural operations in the Sacramento Valley of
California. They reported that the
highest average of respirable-dust concentration was 10.3 mg/m3 air
from soil ripping and land planting carried out on dry surface soil. The lowest dust concentration was from
disking of corn stubble (0.3 mg/m3) into soil during the wet
season. Approximately 64% of all
operations were performed during hot and dry weather producing 83% of the annual
respirable dust for the three-crop systems.
In
an effort to identify whether other studies were being conducted to quantify
particulate matter from animal feeding operations, the USDA Current Research
Information System (CRIS) database was searched for studies dealing with animal
feeding operations. Several studies
were found addressing air quality from its effects on human and animal health
and the development of technology to control the dust and odors emitted from the
facilities. However, there were
only a few studies trying to quantify and predict the amount of particulate
matter and offensive odors generated by these confined animal operations. For example, it has been shown that
electrostatic air cleaning technology (EAC) can improve indoor air quality (IAQ)
by reducing the indoor particular load for very fine particles caused by outdoor
air pollution by 78%. It can also
reduce the number of fine particles produced indoors by 45% according to Rosen
and Richardson (1999), who stated that EAC technology is cost effective and
might be a way forward to improve IAQ.
This type of technology may prove useful in areas that are affected by
agricultural burning operations.
Terpenic
compounds have been reported to be effective in reducing the air bacterial
contamination in livestock buildings.
A new terpenoid called vyterol decreased air bacterial contamination by
64.6 - 71.6% and body resistance improved which ensure a two-fold decrease in
the rate of calves respiratory disease and 11% increase in average daily weight
gain (Frolov, 1997). Canola oil has
been shown to be effective in controlling dust and thereby improving indoor air
quality in swine barns according to Senthilselvan et al.
(1997).
It
is clear that more research is needed to quantify the contributions of all
agricultural operations to the air quality issues we are facing. The research areas proposed by this Task
Force is a start that could help the agricultural industry and regulators assess
causes, importance, and corrective measures of air pollution
control.
2. Health Issues/Risks
Most of the human health
related research on confined swine production facilities has focused on the
health of workers working inside the facilities (Thorne et al., 1996; Thu,
1996). Since the late 1970s, over 25 published studies worldwide have
consistently documented a number of occupational health problems among swine
confinement workers. The most notable of these are a series of interrelated
respiratory conditions such as chronic bronchitis and organic dust toxic
syndrome that occur in approximately 25-30% of swine confinement workers
(ibid:164). Recommended gas (7 ppm ammonia), dust (2.5 mg/m3 total
dust; 0.23 mg/m3 respirable dust), and endotoxin (100
EU/m3) levels have been developed for interior swine
confinement operations based on dose-response research among confinement workers
in relation to environmental conditions (Donham et al., 1995; Reynolds et al.,
1996).
Most research over the last
thirty years on the external environment surrounding large-scale livestock
operations has focused on identifying compounds producing odors (Mackie, 1995;
Miner, 1975b; O’Neill and Phillips, 1992), mechanisms for measuring odor
(Barrington, 1995; Hobbs, 1995), and the development of control technologies
(Lwo, 1995). Much of this work primarily examines odor as a nuisance issue that
should be addressed because it can interfere with the quality of lives of
neighbors. However, a notable shift has occurred in the last few years as rural
physicians receive an increasing number of health complaints from neighbors of
large-scale swine operations. Emerging research and results from several recent
scientific conferences provide evidence of a paradigm shift from one that views
odors as a nuisance to one of assessing odors and associated emissions as a
public health issue.
Four studies have been
conducted directly assessing the health of neighbors living in the vicinity of
large-scale swine operations, three of which have been published in the
scientific literature (Keller and Ball, 2000; Schiffman et al., 1995; Thu, et
al., 1997; Wing and Wolf, 1999). In 1995, Schiffman et al. (1995) at Duke
University published the results of a matched control study examining the
psychological effect of odors from commercial swine operations in North
Carolina. They administered a
standardized mood states (POMS) and total mood disturbances (TMD) scale to 44
neighbors of commercial swine operations and 44 matched controls not living near
such operations. Results showed that the neighbors subjected to odors scored
significantly higher on the POMS/TMD scale, exhibiting significantly higher
rates of tension, depression, anger, and fatigue than did the control group.
Elsewhere, Schiffman et al. (1998) described a variety of mechanisms that
explain how odor can have a deleterious human health effect, including a
physiological pathway between the olfactory lobe and the immune system, which
directly implicate odor as a health risk.
Researchers at the
University of Iowa published the results of a comparative control study built on
the earlier work of Schiffman (Thu et al., 1997). They collected data on the
physical and psychological health of neighbors living within a two-mile radius
of a 4,000 sow swine confinement production facility and compared the results
with data from demographically comparable rural residents who lived near minimal
livestock in Iowa. Results indicated that the neighbors of the swine operation
reported significantly higher rates of four clusters of symptoms that have
previously been documented to represent toxic or inflammatory effects of the
respiratory tract. Most notable is the fact that the configuration of
respiratory symptoms fit a well-documented pattern of respiratory health
problems among swine confinement workers. However, no differences between the
two groups in psychological health were apparent as reflected in the
standardized anxiety and depression scales that were administered. It should be
noted that this finding does not contradict Schiffman’s earlier work since the
scales employed by Thu et al. (1997) measured different dimensions of mental
health.
In 2000, two independent and
separate epidemiological studies commissioned by the state health departments in
North Carolina and Utah respectively examined the health of swine CAFO neighbors
(Keller and Ball, 2000; Wing and Wolf, 1999). In North Carolina, Wing and Wolf (1999)
used a comparative control methodology to assess health symptom reports among
neighbors of swine CAFOs compared with neighbors of cattle operations and
matched rural controls not living near any livestock operations. The results
indicated a significantly higher rate of reported respiratory symptoms among
swine CAFO neighbors consistent with the findings of Thu et al. (1997). In Utah, Keller and Ball (2000) examined
diarrheal and respiratory illness incidence rates among residents living near
Milford, Utah near one of the largest swine CAFOs. Based on hospital discharge
data collected between 1992 and 1998 (the period in which the CAFO was
constructed and became operational) residences of Milford experienced a
significantly higher incidence of respiratory illness compared with control
populations. The findings are consistent with the earlier
work.
One of the suspected culprits in creating neighbor health problems is hydrogen sulfide. Chronic or acute occupational exposure to hydrogen sulfide concentrations near or above 500 ppm (parts per million) is known to result in Acute Respiratory Distress Syndrome (ARDS) or pulmonary edema among swine confinement workers (Thorne et al., 1996). Approximately 20 deaths in swine confinement workers have been reported from exposure to hydrogen sulfide. High level exposures usually occur from agitation of liquid manure in a confined space, where this type of manure handling system is in place. In 1987, the World Health Organization recommended a maximum 107 ppb (parts per billion) ambient air level over a 24-hour period to prevent health problems and 5 ppb over 30 minutes as a threshold for odor nuisance (Sheldon, 1993). These levels compare to OSHA occupational exposure limits of 10,000 ppb for an 8-hour workday (time weighted average). The Minnesota Pollution Control Agency (MPCA) collected data on hydrogen sulfide levels near ten livestock operations in that state and five of the operations exceeded the state standard of 30 ppb (Ison, 1998). Minnesota appears to be one of the few states which actively measure gas levels and applies the WHO standard. Other states have different standards.
It is as yet unclear to what extent hydrogen sulfide, acting alone or more likely in combination with one of the other 160 compounds generated from swine waste, contributes to neighbor health problems. Perhaps most notable in this regard is the fact that research indicates little relationship between hydrogen sulfide and odor levels (Jacobson et al., 1997). This raises the concern that if there is indeed a health problem from livestock emissions, we may be mistakenly assuming that taking care of the odor issue is synonymous with addressing the public health problem. Research is clearly needed to assess the dose-response relationship between neighbor health conditions and swine CAFO emissions.
3. Current Research
Levels
The U.S. Department of
Agriculture’s Agricultural Research Service (USDA-ARS) and Cooperative State
Research, Education, and Extension Service (USDA-CSREES) are the principal
federal agencies conducting or supporting research to develop new or innovative
animal waste management practices.
In recent years these agencies have conducted or sponsored research to
reduce and stabilize the nutrients in animal wastes and to improve waste
composting techniques. The GAO
(1999) reported that for fiscal years 1996 through 1998, the USDA-ARS spent
$13.5 million for this type of research; it expects to spend an additional $9.1
million in fiscal year 1999 having grown from just $3 million in 1996. The USDA-CSREES spent $6.9 million for
this type of research in fiscal year 1997; data for fiscal years 1996 and 1998,
as well as an estimate for fiscal year 1999, were not available. The CRIS (Current Research Information
System) database identified nearly 400 research projects in FY 1997 that related
at least in part to animal waste management, including
odor.
Research
Needs Assessment
1. PM Emission Factors
The air
pollution regulatory process is designed to protect the public. One goal of the process is to insure
that the public is not exposed to pollutant concentrations that are unhealthy
(Parnell and Wakelyn, 1996 and 1999).
If it is perceived that an ambient concentration is too high, then the
allowable emission rates of all permitted sources of the pollutant are reduced
by rule (Parnell, 1992). Emission
factors are used to estimate emission rates and are an integral part of the
permitting process that establishes the allowable emission rates of permitted
operations. In addition, emission
factors are used to estimate downwind concentrations of the pollutant that
potentially could impact the public.
Buch et al. (1998 and 1999) discussed the accuracy of PM10 and
PM22.5 measurements.
There is a
need for accurate emission factors that depict the mass of regulated pollutant
per unit of operation of the agricultural process. For example, the AP-42 emission factor
for a cotton gin is 3.05 pounds of total suspended particulate matter (TSP) per
bale of cotton ginned. In Texas,
this emission factor is assumed to be associated with an air pollution abatement
system described by 1D3D or 2D2D cyclones on all centrifugal fan exhausts and
covered condenser drums on all axial-flow fan exhausts. This abatement system is referred to as
Baseline Best Available Control Technology (BBACT). A 20 bale–per-hour (bph) cotton gin with
BBACT will be projected to emit 61 pounds of TSP per hour. However, the regulated pollutant is not
TSP but PM10. It is
generally accepted by air pollution regulatory agencies (EPA and SAPRA) that the
PM10/TSP fraction of particulate matter emitted by a cotton gin is
50%. Hence, the emission rate of
PM10 a cotton gin (with BBACT) is 30.5 pounds per hour. If the gin operates for 1000 hours, the
annual emissions inventory would be 15 tons of PM10. An alternative calculation of emissions
inventory would be to use the emission factor for PM10 (1.5 lbs/ton)
times the number of bales ginned per year.
If the gin processed 25,000 bales per season, the annual emissions
inventory would be 18.75 tons of PM10 per year. What if the cotton gin had a more
efficient abatement system, what would be the emission rate and annual emissions
inventory? Is the emission rate
accurate?
A cotton gin
will typically have 10 process streams.
The characteristics of the particulate matter emitted by each of the
process streams can vary. In
reality, some of the process streams will have a PM10/TSP fraction
significantly less than 50%.
EPA has
published a number of emission factors for agricultural operations in AP-42
(EPA, 1995) but a number of these emission factors are incorrect. One of the best examples of an incorrect
emission factor is the AP-42 emission factor for grain elevators and feed mills
(Shaw and Parnell, 1997; Shaw et al., 1998; Demny et al., 1997; Buharivala,
1998) {These incorrect emission
factors were recently corrected by EPA.}
The 1988 AP-42 emission factor was 8.6 pounds of TSP per ton (lbs/t) of
grain processed in a country elevator and 9.8 lbs/t (TSP) for a feed mill. These emission factors were based on
study results reported by an EPA contractor with no Agricultural Engineering
expertise and mistakes were made in the protocol. Based upon more recent study results,
the PM10 emission factors for both country elevators and feed mills
have been changed to less than 0.5 lbs/t.
There are a
number of agricultural operations that do not have emission factors or the
emission factors are based upon poor science. Some examples included, field
operations; ammonia and H2S from CAFO lagoons; odors from cattle,
dairy, and poultry operations; and PM10 and PM2.5 from
agricultural burning. When State
Air Pollution Regulatory Agencies (SAPRA) have problems with agricultural
sources, the industries are at the mercy of the SAPRA staff. Any number can be used without
consideration for sound science and engineering. The cost of correcting an
erroneous emission factor or generating a new one is approximately $100,000.
2. Odors and Odorants
The USDA Agricultural Air
Quality Task Force (AAQTF, 1998) has developed a recommended research program on
odors (Table 8). While some work is
in progress related to the AAQTF proposed research agenda, much remains to be
completed. The current level of
research activity is far below that proposed by the AAQTF. Creative solutions to the odor issue may
be needed to forestall more drastic public measures such as stringent siting
standards or zoning limitations on livestock facility siting at the state and
local and national levels.
More attention may need to
be given to means of handling slurries, so that they can be soil injected. Although this is not possible part of
the year, and maybe not practical on some soils and/or into some cropping
practices, if the cost of odor control continues to increase, we might find that
the best overall economics exists by not cropping part of the land associated
with a livestock operation, just to preserve the ability to soil inject
livestock waste material, at least during the warmer parts of the year when the
odor problems tend to be worse.
Likewise, a study is needed
to determine costs vs. benefits with respect to CAFOs and near-by
residences. Community support for
investments in odor control measures on the livestock operation, so as to reduce
the odors to more acceptable levels, without losing the jobs associated with the
livestock operation to other nations is a potential area of further
research.
Wing and Wolf (1999)
reported to the North Carolina Dept. of Health and Human Services that odor is
one of the issues which affects the quality of life of those who live near
confined animal feeding operations (CAFOs). Odorous compounds provide citizens with
evidence that chemical contaminants are present in the atmosphere. The residents reported health effects
that indicate that chemical compounds and biological particulate matter
associated with the CAFOs affected their health. There is a need to understand the impact
of separation distance on quality of life and human health. More research is needed to characterize
air quality as a function of distance from large CAFOs. Odorous compounds such as ammonia can be
measured as a function of distance and the results can be correlated with other
contaminants such as microbial numbers or endotoxin. Sweeten (1998) addressed separation
distances based on odor and waste management. These two studies provide a starting
point for more research. The issue
of safe separation distance is growing in importance, and it should be included
as part of the research on odors and dispersion. It may be possible to reduce the
required separation distance through better odor control
technology.
Some states are either
regulating odors or moving toward regulating odors associated with CAFOs. An example is the Colorado odor emission
regulation for large swine operations.
One of the policy issues relates to whether specific gaseous compounds
(e.g., ammonia, ammonium, organic nitrogen compounds, hydrogen sulfide, etc.)
should be regulated in addition to those listed in the Clean Air Act
Amendments.
Since odors are produced by
many compounds, the research efforts must consider the important individual
compounds that cause the odors and the processes to measure, manage and control
them. The matrix of odor sources
and locations (Table 6) shows that odorous chemicals need to be managed by
addressing those processes where the odor is generated. The environment where the animals are
confined and the waste treatment facilities are often important sources of
odorous compounds. Research to
understand the chemical and biological processes that result in emission of
odorous compounds is often an important step in developing new processes which
reduce odors. This research must
include work to measure and characterize the important odorous
compounds.
Prior research has
established that peak odor conditions may occur at 65% or higher feedlot manure
moisture, and dust conditions can be expected at below 25% moisture (Sweeten,
2000a). Reliable evaporative drying
relationship are needed to predict the early onset of odor or dust conditions
and enable timely interdiction strategies.
Correlations between onset of drought conditions in crops and
pasturelands, which are being widely studied and modeled, versus dust conditions
in feedlots are needed. Odor
research has not been systematically conducted with corn-based rations (the
staple grain ingredient of the U.S. beef cattle feeding industry) in a feedlot
environment, let alone for alternative ration ingredients, ration supplements,
and potential odor control products.
Long term research with standardized sampling and measurement equipment
is needed.
Future research needs to
include: reduced ammonia volatilization, reduced or improved availability of P
in beef cattle rations and thereby, lower levels of pH in manure; and N/P ratios
in manure that approximate crop nutrient uptake rates (e.g., 4:1, 5:1, etc.) as
compared to approximately 1:1 or 2:1 today (Sweeten, 2000a). With watershed-based stream water
quality standards being increasingly dictated by P limitations, and hence, lower
manure application rates, there is no longer an incentive to waste nitrogen to
ammonia volatilization, where it can become an air quality
liability.
In the past, nutrient
budgets have been “balanced” by ammonia losses from the feedlot surface that can
run as high as 50% or more. Now,
however, with water quality focus shifting to phosphorus rather than nitrogen,
application rates will trend lower and indeed N will be needed to approximate
the plant N/P utilization ratio on most crops. Moreover, N volatilization is presently
seen as a potential precursor to fine particulate PM2.5, which is
targeted as a future criteria air contaminant. Technology is being developed at the
laboratory scale for feed additives or surface treatments that will reduce
ammonia emissions for cattle manure (Shi et al., 1999), as has previously been
addressed with swine manure.
According to Miner (1995)
and others, research opportunities having potential to reduce odor complaints
for swine operations and related facilities include:
a. Improved odor identification and
measurement --
·
Improve electronic detection
systems that offer potential to eventually replace labor intensive, high cost
methods of olfactometry.
·
Better define interactions
between odor production, separation distance, climatic data, land uses, and
public acceptance.
·
Develop appropriate odor
indicator compounds (Zhu et al., 1999) such as (long chain) volatile fatty acid
compounds or specific microbes.
b. Better building design alternatives
--
·
Improve manure removal
efficiencies from surfaces.
·
Reduce manure volume and
surface area.
·
Develop innovative building
exhaust air treatment processes.
·
Improve knowledge and
application of dynamics through site selection and dispersion acids (trees,
barriers, etc.).
c. Manure management system
--
·
Manure handling systems that
conserve rather than volatize nitrogen.
·
Energy recovery systems,
including biogas production.
·
Implement scientifically
sound programs of evaluating new products (biochemicals, permeable lagoon
covers, etc.).
d. Land Application
--
·
Develop short term,
temporary treatment alternatives for odor reduction prior to land application
(e.g., aeration, chemicals, dilution, etc.).
3. Dispersion
With
the increasing frequency of interaction between confined animal feeding
operations (CAFOs) and the public, there is a need for research to understand
both the emission rates of particulate matter, ammonia, and odors, and to model
the effects on downwind communities. Basic research is needed to define the
emission rates of particles, ammonia, and the chemicals responsible for odors.
The emission rates must be established as a function of time of day, season, and
atmospheric variables such as temperature and relative
humidity.
The
emission rates of primary particulate matter have been studied to some degree,
but there is insufficient information to establish them as a function of time of
day or season. A significant effort is required to complete this work, but the
objective is easily attainable. There has been somewhat less research on the
emissions of ammonia, but there are no real technical hurdles to overcome in
this area. A significant effort is still required, but it will be relatively
straightforward to accomplish the objective of understanding the diurnal and
seasonal emission rates of ammonia.
There
is a need to establish an objective, quantitative method for the measurement of
odors. The current methods that rely on panels of observers are only
semi-quantitative, at best. Research underway at the University of
California-Davis, Iowa State University, and Texas A&M University is aimed
at establishing more objective methods to quantitatively measure odors. This
work should be continued in earnest. After establishing a method for measuring
odors, further research is needed to understand the mechanisms by which they are
emitted into the atmosphere.
There
is a need for accurate models to predict the downwind dispersion,
transformation, and deposition of particulate matter, ammonia, and odorous
gases. The primary emissions of particulate matter can contribute directly to
the atmospheric burden of particles. Deposition of larger particles, however,
would reduce the impact. Both these processes must be better understood. The
role of ammonia in secondary particle formation is fairly well known, but the
emission rates and the deposition and dispersion parameters must be better
understood. In particular, the emission rates of ammonia during fertilization
and subsequent uptake by the crop canopy are not well known. Finally, accurate
models are needed to predict the downwind effects of odorous compounds emitted
from CAFOs.
Dispersion modeling is used
to (1) estimate downwind concentrations and (2) back-calculate emission factors
given measurements of downwind concentrations. Emission inventories are used by SAPRA
in their strategic planning to reduce exposure of the public of
PM10. If the existing
emission factor is in error, and is multiplied by a large number, the resulting
emissions inventory will be in error.
For example, in Texas, there are approximately 3,000,000 head of cattle
on feedyards each year. An error of
10 pounds of PM10 per 1000 head per day (lb/1000hd/d) would result in
an error of over 5,000 tons in the emissions inventory.
The
determination of emission factors is not as simple as some would perceive. A measurement PM10
concentration does not yield an emission factor, directly. One of the key variables in determining
emission rates and emission factors is the dispersion model used to
back-calculate the emission rate.
Parnell et al. (1993) used the EPA approved Fugitive Dust Model (FDM) and
data reported by Sweeten et al. (1988) reported that a more correct
PM10 emission factor for cattle feedyards would be 2.5
lb/1000hd/d. McGee (1997) used the
Industrial Source Complex version 3 (ISC3), and concentration data reported by
Sweeten et al. (1988) reported that a more correct emission factor for
PM10 for cattle feedyards would be 20 lb/1000hd/d. Neither of these authors corrected for
rainfall events. Both used the same
data and reported different results because they used different dispersion
models to back-calculate the emission factor.
The
AP-42 PM10 emission factor for cattle feedyards is 70
lb/1000hd/d. This 70 lb/1000hd/d
factor was reported by Peters and Blackwood (1977) using concentration data
reported by Algeo et al. (1972).
Peters and Blackwood used a line source algorithm to back-calculate the
emission rate but they made significant errors and a number of assumptions that
could not be verified. Parnell et
al. (1999) used new concentration data with ISC3 and found that a more correct
PM10 emission factor should be 15 lb/1000hd/d (corrected for rainfall
events).
Meister et al. (1999)
reported on research progress in the development of a new model that could be
used to predict downwind concentrations from ground-level sources that addressed
the problem of the Gaussian distribution in the vertical plane. The ISC3 model reflects the portion of
the normal distribution in the vertical plane that would theoretically be
under-ground resulting in a maximum concentration at ground level. This unique distribution was referred to
as a “double-normal” distribution.
In reality, the maximum concentration in the plume downwind moves upward
as the plume moves away from the source.
Meister replaced the “double-normal” distribution with a triangle
distribution. Some researchers have
used a “box model” to back-calculate emission factors. For example, if the plume height were
assumed to be 4 meters with a field width of ‘W’ meters, the box area would be
‘4W’ m2. Given a wind
velocity ‘u’, the volume rate of flow could be determined and with a
concentration measurement, one could calculate the mass of PM10
emitted.
Emission factors are a
measurement of the PM10 emission rate from the pollution source or
sources. For a cattle feedyard, the
source of PM10 is the manure pack -- the area where cattle are
walking and stirring up dust that can be carried by wind to the sampler. The sampler is stationary throughout the
sampling period. Wind direction and
velocity cannot be controlled. If
the uncontrollable factors result in a measurement of PM10
concentration that is not an accurate indicator of PM10 from the
pollution source, that data should not be used to determine the emission
factor. (For example, if the wind
direction was such that the dust came from a field off to the side of the
feedyard, the concentration measurements could not be used to estimate in an
accurate emission factor for cattle feedyard.) Note that the measurement of
PM10 concentration with the situation depicted in Figure 1a would not
be related to the emission rate (factor) of the feedyard surface.

Another factor that is
misunderstood is that emission factors are not directly proportional to
concentration. In other words, a
high PM10 concentration does not necessarily mean that the emission
rate is high. (This is
counter-intuitive because the public would believe that a high concentration
would indicate that there was more dust being emitted from the source.) To illustrate this, refer to Figures 1b
and 1c. In this simple example a
square feedyard with a constant emission rate (factor) is the source of the
PM10. If the change in
wind direction for one sampling period is wide (Figure 1b) compared to another
sampling period where the change in wind direction is narrow (Figure 1c), two
different concentrations will result for the same emission factor. This is a consequence of the same mass
of dust being emitted but this mass is dispersed into different volumes. Concentration measurements are a measure
of mass per unit volume. All
determinations of emission factor (rate) must be calculated using a dispersion
model that accounts for changes in wind direction and wind
velocity.

4. Indoor Air Quality, CAFO
Buildings
Indoor
air quality is a significant concern in swine and poultry production. Ammonia, hydrogen sulfide and odorous
compounds dissolved in the air and particulates are present in indoor air in
CAFOs. The particulates include
dust from feeding activities and animal movement as well as particles from the
animals and feces present in the building.
The dissolved gases and particulates impact both animal and human health
(Donham et al., 1986; Donham et al., 1989; Hartung, 1994; Thorne et al.,
1996). Several studies have been
conducted to characterize the dust in confined CAFO facilities (Heber et al.,
1988a and 1988b; Maghirang et al., 1995; Maghirang et al., 1997; Maghirang and
Puma, 1997; Pickrell et al., 1993; Riskowski et al., 1998). The dust particles often include
endotoxins, mycotoxins, bacteria, fungi, virus, insect parts, feces, and
proteins, as well as inorganic matter.
Ventilation
research to develop better methods to manage and control indoor air quality is
in progress at Kansas State University and other locations. Methods to remove particulates from the
air are being investigated as well; however, more research is needed to address
this important problem of indoor air quality in CAFOs. Finding solutions that are cost
effective is a significant challenge.
5. Health Effects
It appears from Wing and
Wolf (1999) there may in fact be identifiable health concerns associated with
certain confined livestock installations in relation to health and quality of
life issues near livestock operations.
It suggests there may be further avenues to explore relative to health
affects.
Conversely, the data also
suggests either no adverse or even positive health benefits from living
down-wind from a cattle operation, in that the respondents reported less of
certain problems in the cattle areas, than in the control areas. Here again,
this might merit further investigation.
Experience with animals suggest there are in fact some differences among
various categories of livestock in their response to various treatments, and
perhaps there may be similar differences among humans, based on gender, race,
geography, childhood environment (rural vs. urban), etc., in response to
agricultural air quality exposures.
Wing and Wolf (1999)
suggested strongly that we cannot ignore the issue of livestock odor, and the
associated particulate chemistry, physiology, geology, and transport. It appears that much more needs to be
understood about kinds of bacteria, viruses, etc., from confined livestock are
being carried on airborne particulates emitted from or passing through the
vicinity of livestock operations.
The geology, agronomics, and natural vegetative status of the location of
livestock operation might need closer attention.
There is a need to conduct
research to address the air quality environment in confined swine and poultry
CAFOs. Further research is needed
to understand the health effects.
Because of the large number of different contaminants present, the
identification of compounds that impact health is difficult. Very little has been done to relate
cause and health effect in the complex swine environment where several
contaminants may be acting together to have an effect that is much greater than
any of them alone. For example, ammonia adsorbs to dust particles and may be
carried to the lungs by small dust particles. Biological particulate matter is of
concern and endotoxin has been reported to affect worker
health.
Research is needed to
characterize the chemical compounds dissolved in the air, the sources, sizes and
composition of the dust particles, and the biological particulate matter. The biological particulates are of
significant concern. They include
non-pathogenic and pathogenic organisms; bacteria, mycobacteria, fungi, and
viral components; endotoxins, mycotoxins, glucans, and other microbial products;
aeroallergens; insects and insect parts.
Swine influenza can be transmitted to humans. Hepatitis E can be transmitted from
swine to humans. Thus, research is
needed to more fully characterize the air, especially the particulate
matter.
Technologies that can be
used to reduce and control the level of contaminants in the air are needed. While some research has been completed
on dust reduction with oil sprays and ventilation, no technology has been widely
adopted other than increased ventilation.
In the winter, this has a thermal impact which must be considered. In ongoing research at Kansas State
University, the locations of fresh air input to the building are being
investigated with emphasis on supplying the fresh air to the area where the
workers spend most of their time.
In the AAQTF research needs
statement for odor (Table 8), Priority #4 has been added to address indoor air
quality at agricultural operations.
This research need is important and additional funding should be
requested to advance the science and technology required to understand the
composition, sources, fate of contaminants, and control technologies. Further health effects research is
recommended as well.
In the outdoor environment,
the impact of flies and other insects on health effects should be
investigated. Insects transport
microorganisms as they move about.
Thus, there is the potential for insects to carry disease from one CAFO
to another and from a CAFO to a nearby residential area.
The challenge to the
agricultural industry and the agencies which directly serve the industry is to
keep current on the research done by the health agencies, monitor their research
methodologies, and be very aware of the inferences being made by them from the
data and associated statistical conclusions. And, where appropriate, intervene with
advice and counsel to these agencies, as well as providing public information if
necessary to counter their claims and data.
In addition, the industry
must continue to provide a significant level of industry sponsored research to
investigate not only production problems associated with livestock, but also the
public health concerns. Failure to
do so will send a message of non-concern to the general public, and giving them
impression that producers do no care about the pressing environmental
issues. Research is clearly needed
to define the relationships between odor, specific odorants (such as
H2S) and health effects, both on- and
off-sites.
It not only will be major
good public relations for agriculture to sponsor some of the health affects
research, but will bring us the added benefit of being better able to protect
the community interest and the health of producers and the process, we need to
be doing economic research concerning the cost of making adaptations to provide
for reduced adverse health affects.
Technology
Transfer Program Needs
1. Producers and Private
Industry
Producers
need to have the opportunity to be educated on proper Best Management Practices
(within their industry) to enhance environmental responsibility. These practices need to be based on
sound science, not sound bites and emotional rhetoric. Producers have traditionally responded
favorably to economically feasible practices that would enhance their production
while improving their environmental practices.
EPA's
efforts to continue to impose more regulation often do not come from scientific
evidence or from a real desire to work with producers to enhance air
quality. EPA often appears to be
operating from a political agenda that has no practical or legal
basis.
From a farmers viewpoint,
the process of keeping current and compliant with increasingly complex
regulations will increasingly be a major force driving consolidation of farming
operations. To survive the
environmental planning demands, farmers will increasingly and collectively
contract with environmental planning consultants to help keep them “legal” on an
ongoing basis. We need to track
what is happening to these kinds of incremental costs being imposed on the
agricultural industry. Unless we
understand the cost consequences of well-intentioned requirements, the
regulatory cost burden will handicap successful international market
competition, diminish industry incentives to become proactive, and undermine
industry support for environmental enhancement programs.
Producers should be provided
with a menu of technology delivery mechanisms, including but not limited to
publications, web page access, field tours, and demonstration projects. Demonstration projects, for example,
will be increasingly valuable in bringing about adaptations to some of our more
pressing environmental issues.
We need to be able to
demonstrate, on a commercial scale, that some of the remedial ideas are really
both technologically and economically feasible. And, if they are not economically
feasible, but are technologically feasible, the demonstration projects would
assist materially in determining some level of reasonable public assistance for
industry participants if they are to adopt technology not justified by the
economic status of their businesses.
The shorter the time period the public demands for these adaptations, the
greater the public assistance need will likely be. In many respects, the primary benefits
are to the general public, not to the owner and operator of the farm or ranch
business.
CAFO operators in the future
will continue to focus attention on feedlot waste management and water and air
pollution abatement both for regulatory compliance and for operational
improvement (Sweeten, 2000a).
Obvious benefits of an increased focus on manure and wastewater
management include: 1) control of
air pollution (odor and dust); 2) control of surface and ground water pollution;
3) maintain or increase animal productivity by providing well-maintained feedlot
conditions that provide all confined animals with a similar production
environment; 4) recovery of nutrients in the form of fertilizer, feedstuffs or
energy; and 5) maintain or increase efficiency of the CAFO by avoiding
operational obstacles such as muddy pen surfaces, excessive stockpiled manure,
and underutilized feedlot runoff in holding ponds and settling basins that
increase potential for discharges.
2. General Public and Affected
Neighbors
When
livestock operations were smaller, the industry was much more flexible. Livestock operations could be expanded
and contracted with the ebb and flow of economic conditions, and even moved if
community development encroached upon them. The affected air shed area was much
smaller, and dispersion of odor and other livestock associated problems
dissipated in a much smaller geographic area. Far fewer neighbors were affected, and
local communities were seldom impacted severely over a long period of
time.
However,
as economic pressures and technology increased the potential scale of livestock
operations, the tonnage of manure and other waste products increased
dramatically, the investment capital became millions, and the operations spread
over hundreds, and even thousands of acres. Water and air quality concerns of
community members mounted significantly as the scale of operations increased,
resulting in the community and neighbors taking a much different view of these
operations.
Often
the operations are no longer "local people", but corporations from "outside" the
area. As a result, the local
citizens and authorities do not identify personally with the people associated
with the livestock operations as much as they might have when the scale of
operations were smaller and the proponent was a recognized local family. There is now more "us" vs. "them"
political dynamics, with the associated resentments and hostilities, and a lack
of understanding of the technology and economic dynamics.
As
the scale of livestock operations increases, in order to generate cost
efficiencies and maintain lower consumer prices for livestock products, the
general public and neighbors of these operations need to be better informed
concerning both the reasons for the consolidation, and the consequences (both
positive and negative) for the local communities.
As
scale of livestock operations increase, the community consequences of these
large-scale operations also changes the relationship between the livestock
operation and the community. For
natural resource based businesses in general, one of the increasing dilemmas is
how to implement the ever growing scale of operation without having the negative
consequences serve to generate resentment and hostility among members of the
community, resulting in costly public relations and political backlash for the
livestock operations. It would be
far more productive if the exchange of information and concerns were undertaken
among the interested parties, with a focus on mutual "opportunity" rather than
just "fears" and "paranoia".
Local
communities now have such a stake in the development of these large-scale
livestock operations that the community might appropriately be considered a
"partner" in any such development.
Larger scale livestock operations that take such a reality into
consideration, and manage their expansion planning with recognition of this
local political, social and economic dynamics are bound to develop more
community friendly proposals, and meet with less resistance, and quite possibly
in the process actually achieve some level of community support in the form of
investment incentives.
As a
result, it will become increasingly important that new or expanding livestock
operations carefully consider the likely impacts, both positive and negative,
relative to the community and nearby neighbors. In addition, due to the airshed
transport of odors and associated concerns, the idea of "community" must be
expanded to include all those persons within the affected airshed, not just the
local towns. No longer can a
livestock operations operate as if they had an inherent right to do whatever
they like on their property.
Because of odor transport, the expanding livestock operation must think
"airshed dynamics" not just "private property", for they must somehow address
the impact of their operations across all parts of the local airshed impacted by
their operations.
Legal
actions, statewide ballot measures aimed at restricting livestock operations and
other activity of community members across the nation clearly signal that local
people no long assume they just have to tolerate the consequences of large scale
livestock operations. Statewide
moratoriums on development of large-scale livestock operations signal that
communities are now willing to simply terminate large-scale livestock
operations, unless somehow a better way of dealing with unwanted consequences is
developed.
For
both air and water, all the potential "Beneficial Uses" of the air or water
resource must be considered in today's world of environmental concern. Anyone who fails to do so, will likely
soon find themselves "nose to nose" with someone who represents one or more
other beneficial uses of air or water that is or may be adversely affected by a
proposed expansion or development that uses the same resource in an airshed or
watershed. The "Community of
Interest" must increasingly become a significant part of any large-scale
proposal or operation, if the investors and operators wish to solicit community
support and understanding.
Increasingly,
agriculture is faced with land use planning and zoning regulations to restrict
land uses that pose one or more unwanted consequences on the community,
especially to neighbors of livestock operations. Increasingly, livestock
operations are seen as being little different from any other "factory" or
industrial development that has potentially adverse impacts upon the
community.
As a
result, livestock operations must increasingly make a choice between taking the
initiative in dealing effectively with these community concerns, or acting
defensively as the community attempts to impose their preferences on the
livestock operations, often just shutting them down, or imposing high compliance
costs relative to environmental regulations imposed by the community. The concept of "Community of Interest"
demands that for mutually beneficial development to take place, with general
community support, there must be increased "Community Understanding" of issues,
concerns, technology and economics.
One
technology needing considerably increased attention relative to livestock
operations is the socio-political technologies involved in managing the dynamic
interaction between the development proponents and impacted parties, that is,
the means by which "listening" and exchanging information can be more
productively managed in the course of presenting development proposals to the
community.
Since
any major expansion of a livestock operation is indeed a "community impact", it
will increasingly be necessary for the livestock industry to work with state and
local authorities, and sometimes with regional authorities to develop action
plans and policy to protect the expansion capability of livestock operations
without imposing unreasonable negative impacts on the community. Most likely this will result in the
industry together with the greater community developing siting criteria for
expanding livestock operations that consider both air quality and water quality
concerns, and the associated health impacts, in relation to typical odor and
water contaminant transport patterns.
In
addition, in order to provide long term protection for the investment in these
large livestock facilities, there will likely need to be zoning restrictions in
the area that prevent residential and commercial development within some
reasonable radius of the livestock operations. "Covenants Not to Sue" may be required
additions to property deeds prior to permitting any other development within a
certain distance from an already permitted livestock operation. "First Option to Buy" agreements might
be encouraged, in order to allow livestock operations to purchase land within a
protective buffer area around a large scale livestock operation, so that buffer
areas can expand rather than contract over the longer
term.
In
some states, Oregon for example, the land use planning process provides a
mechanism called a Conditional Use Permit.
This permit allows certain kinds of development, but the permit process
provides that the operation can only be located on a given site if it complies
with certain conditions imposed to protect the interests of the rest of the
community, including nearby neighbors as well as watersheds and local
communities. These permits are
reviewed periodically, and complaints are investigated to determine the extent
to which the Conditions are being met, and/or need to be changed. The conditions are designed to protect
both the interest of the investors and operators, and the interests of the
community, to assure long term mutual benefits, to minimize conflict and to
assure compatibility among various land and other resource uses in the
area.
Such
permitting procedures may seem like a burden to the livestock operations, and
they certainly are. In addition,
they can delay development, and impose unforeseen costs and difficulties. On the other hand, the permitting
process allows all concerned parties to assess the likely impacts of the
proposed development, and consider how best to manage those impacts for minimum
cost to the community as a whole.
Such
a permitting process, if managed well, provides opportunity for public
education, for thorough review of the site engineering and operating plans and
associated consequences to the general public, especially those living
nearby. The result is a livestock
operation established on the basis of good public knowledge of what is proposed,
a through review of the engineering and consequences, with conditions imposed
that reasonably assure the community that their interests will be protected, not
only in the short term but in the long term. If a satisfactory mutual conclusion
cannot be reached between the proposed livestock operation and the community,
then the siting would likely be denied.
Such
a permitting process can pose a major dilemma for the proposed livestock
operation. Such a permitting
process generally complicates the development, at least in the short term, and
the process can cost the community a good source of jobs and related local
economic activity, especially if the community does not develop an early
productive working relationship with the proponents of the
development.
On
the other hand, by undertaking such a process, both the investors and the local
people have the opportunity to assess mutual costs and benefits before hand, and
avoid making decisions that might otherwise result in a long term costly running
battle between the livestock operation/s and the community, possibly resulting
in major investment losses and long term detrimental community
circumstances.
In
order for future large-scale livestock operations to achieve community support,
they can most likely learn a lot from how some of the more successful industrial
concerns manage proposed new siting situations. Those organization who do their homework
well, who meet with concerned citizens and sincerely take their concerns into
account as they engineer the new project, and then make well planned
presentations to appropriate community interest groups and authorities, can move
through permitting processes efficiently, and end up with a high general level
of community support and respect for the proposed project and the people
presenting and operating it.
In
order to maintain and improve the overall efficiency for large scale livestock
and other large scale agricultural operations over coming years, such community
focused investment proposal and permitting processes should be studied and
considered in relation to legislative and public policy processes, in order to
develop more effective interaction between private investment and public
concerns in the agricultural industry.
The livestock industry should take considerable initiative in this
process, to assure that their needs are appropriately addressed relative to the
needs and preferences of the overall community of interests in which they must
function over the long term.
3. Public Programs
GAO (1999) reported that for
fiscal years 1996 through 1998, federal agencies provided a total of $384.7
million in financial and technical assistance to producers for animal waste
management. These agencies
estimated they would provide about $114 million for this purpose in fiscal year
1999. USDA provided most of this
financial and technical assistance -- $326 million or about 85% -- to animal
producers through its cost-sharing programs, especially EQIP. In addition, USEPA and USFWS provided
10% and 5% respectively of the financial and technical assistance provided to
livestock and poultry producers for animal waste management from fiscal years
1996 through 1998.
Unfortunately none of these
fundings specifically address emissions to the air or odors. Even EQIP administered by USDA-NRCS does
not directly single out animal air quality issues. However, it does not preclude actions
that would assist air quality issues but local officials and farmers have to
recognize the need for these actions and prioritize them higher over
conservation applications that may be more important for other objectives such
as water quality.
Presently most funding is
being used for the construction of animal waste storage and disposal
systems. There is a need for local
officials and farmers to realize that odors and emissions to the air such as
hydrogen sulfide should enter into design considerations of such
facilities. Also that applied
conservation measures for water quality will probably be positive impacts on air
quality but probably will not address the air quality issues totally. A holistic planning approach that
considers all five resources (soil, water, air, plants, and animals) is
recommended.
4. Technical/Engineering
Assistance
Holistic approaches that
conjunctively control surface and groundwater contamination and also dust and
odor emissions while maintaining high confined livestock productivity and health
standards will be needed (Sweeten, 2000a).
In the last two or three decades, producers, researchers, educators and
providers of technical assistance have focused primarily on “obtaining permits”
and meeting today’s unsophisticated regulations, rather than on discovering and
attaining new levels of technology.
One of the chief reasons for this may have been the single-minded USEPA
criteria of “no discharge,” which since the mid-1970’s, has focused on surface
water protection.
In the future, as research
from USDA-ARS and USDA-CSREES provides more complete understanding of “cause and
effect” relationships to air quality and production agriculture, holistic
approaches become even more important.
American farmers can not afford a piece meal approach that would be
forced on them by a regulatory command and control system. For example, to design a farm operation
to meet permit requirements for water quality at one point in time and then to
retrofit that same operation later to meet new requirements for air quality
permits will require extensive technical assistance. This appears to be the approach our
nation is taking. That logically
means that the next major farm legislation must provide increased funding for
outreach, information, education, and technical assistance or else expenses for
these types of technical services will be another economic burden especially on
marginal farmers.
Discussion
of Recommended Program ELEMENTS
1. Prioritized Topics
A. Continue to encourage and provide very
significant funding for research to more accurately identify emissions and their
real impacts to air quality based on scientific fact, rather than
perceptions. This includes
developing emission measurements for manure handling systems in all species and
phases of livestock production.
(1) Confined livestock --
open lot systems.
(a) Corral scraping and
stockpiling with periodic removal.
(b)
Composting.
(c) Open lagoons or holding
ponds.
(d) Covered lagoons utilizing
methane recovery as an alternative.
(e) Land application of
manure and wastewater.
(2) Confined livestock --
enclosed building systems.
(a) Confinement
buildings.
(b) Liquid manure treatment
and storage systems.
(c) Land
application.
B. Conjunctively address critical
points in water and air quality relationships.
(1) Determine impacts of
controlling or reducing emissions with water and air quality
jointly.
(2) Develop holistic
systems.
C. Develop educational programs for
livestock producers.
(1) Explore regional as well
as state and national emphasis.
(2) Adopt currently available
research on closely related systems and solutions.
(3) Provide guidelines to
USDA-NRCS and USDA-CSREES for dissemination by Cooperative Extension and
producer groups in all applicable states.
(4) Provide the means by
which the national and regional centers and consortia on livestock waste
management can operate to pool knowledge and coordinate
effects.
(5) Provide the means and
incentives for state-focused research and education programs to operate
effectively within the context of state and local conditions and
requirements.
D. Incorporate economic assessment of all
costs of technology, implementation, and management to the livestock production
industry to meet all existing and proposed mandates.
E. Involve the USDA-AAQTF in
development of funding and implementation of research, education/extension and
technology transfer programs.
2. Partnerships
Partnerships insure the
cooperative atmosphere for implementation of practices addressing environmental
concerns on the farm. Various
cooperative efforts are underway which address air quality issues, including the
AgStar program administered by the USDA-NRCS and the federal
EPA.
In addition, there is the
National Pork Producers Association Stewardship Program which address
environmental issues through outreach, education, and implementation. Also, Dairy Quality Assurance Program, a
joint agreement between the California Department of Food and Agriculture,
Natural Resource Conservation Service, USEPA, and USDA and industry
groups.
As legislated in the farm
bill, producers have available the Environmental Quality Incentive Program
(EQIP) to implement innovative proven control strategies in a cooperative
arrangement. Administered through
the USDA-NRCS, funds are available to offset the cost of implementing these new
control measures.
3. Budgetary Requirements &
Recommendations
Congress has provided new
funding to USEPA to acquire $80 million for instrumentation to measure
PM2.5 nationwide but has not provided new funding to allow
agriculture to do adequate, sound science to find out causal relationships to
allow this industry to be proactive.
In earlier recommendations
this Task Force suggested that Congress appropriate annually $20 million for
EPA, and $20 million to USDA for air quality research plus $25 million to NRCS
for technical assistance directly to local officials. Under the latest MOU between USDA and
EPA, it is agreed that these local officials will be the decision makers to
decide if applied conservation is adequate to meet the best practices developed
in state implementation plans.
Local officials need the research to be accomplished in a sound
scientific manner and technical information to be available from state Extension
and NRCS field personnel.
Specifically, the USDA
research funds are to be split equally between CSREES and ARS with at least $8
million for animal (odor and emissions) research. Of the $25 million to NRCS for technical
assistance, $4.5 million is recommended for animal issues and $300,000 for
training efforts for field staff.
These new fundings are desperately needed for agriculture to do its part
to improve the health of the American air resource.
4. Implementation – Initiatives,
Agency Actions, etc.
With appropriate new
funding, ARS has already held pubic meetings to plan a long term agriculture air
quality program. Management has
identified issues, priority locations across the nation where the problem can be
studied and the types of expertise needed to carry out a long term research
plan. The only thing that is needed
is new funding.
CSREES already has a grant
program to the states that have the air pollution problems. Unfortunately, it is less than $1
million per year for all air quality efforts including animal
considerations.
At the technical assistance
level, both NRCS and Extension funding is lacking. Nationally, less than 11 FTEs are
provided for this extremely critical effort. Last year USEPA expanded the
non-attainment areas for air quality from 10 to 78 and most of the first 10 were
upgraded from moderate to a sever rating.
All the agencies above have
attempted to include air quality in their budget proposals. However, with caps at the Secretary’s
level, that translates to competing with the “Food Stamp Program” or “Meat
Inspectors Program.” It is hard to
argue with starving people that they need clean air. But not many people are starving in
America and premature death due to air quality is a reality in
America!
Summary
Issues
Overview
Animal agriculture in the
United States is a $100 billion/year industry. The U.S. is the world leader in
efficiency of producing meat, milk, poultry and eggs, largely attributable to
increased development of concentrated animal feeding operations (CAFOs). The percentage of domestic livestock in
concentrated animal feeding operations varies nationally and regionally from
only 10% of the nation’s beef cattle inventory to virtually 100% of swine and
poultry. CAFOs have been closely
regulated for the last 25-30 years under federal and state clean water laws,
regulations and policies, and considerable funding has been directed to water
quality research, demonstration, education, and technical assistance for
CAFOs. Air quality from CAFOs has
received only secondary consideration, despite recently increased public
concerns and policy attention.
Water and air quality protection are inseparable, and the CAFO-related
research, technology transfer, and federal and state programs should be linked
accordingly and funded adequately, at levels commensurate with public concerns
and rapidly-developing scientific expertise at land grant universities and
federal laboratories. Producers
will need adequate lead-time, cost-effective technologies, and resources to
adjust to changing public agendas that include air quality
protection.
CAFO Air Quality
Parameters
CAFOs including swine and
poultry operations, dairies and cattle feedlots, can affect air quality through
emissions of: odor, odorous gases (odorants), particulates, and/or some of the
so-called greenhouse gases. Sources
include: open lots and confinement buildings, manure/wastewater storage or
treatment systems, land application, and animal mortalities. Emissions load on the atmosphere is the
product of contaminant concentration and airflow rate; and research is underway
to develop and demonstrate cost effective ways to reduce either or both these
basic components.
Odor from CAFOs sources, as
experienced by humans, is the composite of as many as 170 or more specific
gases, present in trace concentrations either above or below their olfactory
thresholds. Odor is characterized
according to: strength (concentration or intensity), frequency, duration,
offensiveness, and hedonic tone.
Odor strength is measured by various types of dilutions to threshold
devices (olfactometers) using human odor panelists; by determining the identity
and concentration of individual odor gases; or by electronic “noses”, which are
in their infancy. Reproducible
techniques for odor/odorant sampling, storage and transportation, and
presentation to panelists have been developed, yet are undergoing further rapid
development worldwide, because of high cost and labor requirements.
Odorous gases of concern
today include ammonia and hydrogen sulfide. Considerable research in Europe and more
recently in the U.S. has been devoted to monitoring these two fixed gases in and
around confinement buildings, partly in relation to animal and human health
concerns, and within and around open feedlots and dairies. However, the importance of ammonia and
hydrogen sulfide to downwind composite odor as perceived by neighbors is
questionable, according to evidence to date. Nevertheless, so-called emissions
inventories that include data from often dissimilar systems in Europe have been
compiled by EPA and used unwittingly in some states, despite thin and often
specious databases.
In
the U.S., ammonia emissions have long been encouraged as a legitimate means of
balancing the nutrient equation for water quality protection purposes. Feeding and manure/wastewater management
systems have been designed accordingly on a widespread basis. A reversal of form of a rather
structural nature will be needed as water and air quality protection are now to
be viewed conjunctively.
Field and laboratory
research has largely focused on measuring concentrations of odor (e.g., odor
units (OU)) or odorants (e.g., micrograms/cu. meter, or ppm) in air within and
in close proximity to confinement buildings and open lot feeding systems. However, assessments of air quality
impact also requires data on:
·
emission rates (mass/unit
time), e.g., kg/day;
·
flux rates (mass/unit
area/unit time), e.g., kg/sq. meter/day;
·
emission factors (mass/unit
of throughput/unit time), e.g., kg/head/year.
The
committee has found a substantial number of data sources from the U.S. that
provided concentration data from
swine operations or from laboratory studies involving swine manure; not
surprisingly, the preponderance of this data comes from the upper Midwest or
from the mid-Atlantic states.
Interestingly, ammonia emissions appear to occur with diurnal
fluctuations, while hydrogen sulfide emissions occur in bursts from anaerobic
storages or lagoons. To a lesser
extent, similar data exists from poultry (Midwest and Southeast), dairy
(Midwest, Northeast, and West Coast), and beef feedlot operations (Southern
Great Plains and West Coast).
However, a paucity of data exists on emission rates, flux rates, and emission factors from these sources and
the many different manifestations of manure and wastewater management systems
within each species. Where such
data has been reported, it shows a wide range; consensus numbers appear
elusive. Further research by
well-qualified and well-equipped laboratories is needed as a precursor to
rational attempts to develop policies for CAFO odor and
odorants.
It
is believed that future research will be directed toward odorous gases that more
closely correlate with odor as perceived by humans--the discerning public. Candidate compounds may include volatile
organic compounds (VOCs) such as the volatile fatty acids, amines, alcohols,
aliphatic aldehydes, p-cresol, indole, skatole, or mercaptans. The above admonitions on data quality
and standardization of useful expression will apply as alternative compounds are
studied and attempts made to relate them to odor.
It
has long been known that carbon dioxide and methane (non-odorous fixed gases of
digestion and organic matter decomposition) are produced both by confinement and
range/pastured livestock and poultry.
Refinements in animal rations have improved digestibility, reduced manure
loads, and shortened the production interval of meat animals, and thereby
contributing to lowered emissions.
With appropriate incentives for adoption, known technology for energy
recovery from liquid manure treatment systems, together with state-of-the art
open lot manure and holding pond management practices, may be able to further
reduce emissions of these so-called greenhouse gases, which are not part of the
regulatory fabric regarding air quality.
Unlike odor and odorants,
particulates have been explicitly regulated as one of six criteria pollutants
under the Federal Clean Air Act since the 1960’s. Total suspended particulate (TSP)
standards for ambient air quality were replaced by PM10 standards in
1987, and recent USEPA proposals have addressed fine (“respirable”) particulate,
regarded as PM2.5.
Particulate sources from CAFOs include: feedmills, feedstuffs storage and
handling areas, open lots, confinement buildings, roads and alleys, manure
handling, solid manure storage or composting areas, and land application. Except for feedmills, these sources have
been regarded as fugitive emission sources.
Emission
Factors
Stemming from old TSP
databases developed for other purposes, USEPA and its contractors of the 1970’s
extrapolated and subsequently synthesized original emission factors (published
in AP-42) that have since been proved atypical by subsequent research. Refinements are in progress based on
more accurate recent data that includes actual PM10 field
measurements and modeling for cattle feedlots in the Southern Great Plains,
where over 75% of he nation’s beef cattle are fed for slaughter. Attempts to extrapolate air quality data
from beef cattle feedlots for dairy applications or vice versa are
ill-advised. It has proved
inordinately difficult to correct poorly-conceived emission factors,
notwithstanding new, superior data.
Therefore, improved processes for updating emission factors for an array
of CAFO-related air contaminants in the future should be
developed.
Available data bases on
PM2.5 for CAFOs are very thin or nonexistent, although a few
laboratories are becoming equipped to supply this data in the future for dairies
and feedlots (California and Texas, for example). Evidence exists of rapid, predictable
fluctuations of PM concentrations from open lot and animal confinement buildings
alike owing to periods of heightened animal activity as triggering mechanisms,
over and above more or less basal PM emission levels, possibly suggesting future
topics of research and innovation, along with conventional control
technologies.
Human Response and Health
Effects
Concerns with health effects
of odor, odorants, and PM from CAFOs extend to livestock health/performance
issues, and to humans working within or living in proximity to such
facilities. These health-related
issues, and applicable prevention technologies, may or may not be coupled. It appears that confinement swine
facilities have been the focus of most of the research to date, followed perhaps
by the poultry industry, as confinement buildings are the sites of highest air
contaminant concentrations and exposure durations. One of the artifacts of increased animal
concentration and industry consolidation may be an increased industry capacity
to address both the on-farm as well as off-farm issues regarding potential
health effects. Recent evidence
suggests greater secondary health effects on frequently-exposed neighbors than
previously documented, insofar as confined swine operations are
concerned.
Current Federal and State
Policies
Federal and state policies
regarding CAFOs have been in existence for decades. Water quality concerns were addressed in
the Federal Water Pollution Control Act of 1972, which listed CAFOs as point
sources. Accordingly, federal
effluent limitation guidelines (ELGs) and National Pollutant Discharge
Elimination System (NPDES) or state-equivalent permits soon followed, and these
were one-dimensionally focused on protecting surface water quality through
no-discharge requirements. As
documented in this report, individual States, and more recently USEPA regions
(e.g., Region 6), subsequently have followed suit by adopting a virtual
patchwork of tailored policies and regulations that have attempted to address
voids of groundwater protection and nutrient management, and in a minority of
cases air quality concerns, that were not addressed in USEPA’s 1974-76 ELGs,
which are still in effect. It is
notable that USEPA plans to release new ELGs for CAFOs in December 2001;
presumably, these may level or at least straighten out the playing field to a
certain extent.
Integrated
Programs
USDA agencies, land grant
universities, and private industry associations, often times in partnerships
with USEPA, local soil and water districts, and state environmental protection
agencies, have launched coordinated research, education, training, technical and
financial assistance programs to address water quality concerns and to enable
the progressive attempts of CAFO operators to design and operate manure and
wastewater management systems that address extant public policies as well as
improve performance, productivity, beneficial use of nutrients, and minimize
liability with respect to neighbors.
Despite lingering problems in some areas or specific watersheds and
notwithstanding public funding limitations, these programs plus the infusion of
massive private investments on the part of CAFO operators have largely addressed
the nation’s water quality concerns and kept enormous quantities of manure and
wastewater from being discharged off site and into streams, but rather put to
beneficial use on crop or pasture land either on- or off-premises. Current or previous partnerships include
the USDA interagency Water Quality Initiative, USDA/NRCS EQIP program; the
National Pork Producers Council’s Environmental Quality Assurance Program; and
the new USDA/USEPA Unified National Strategy for Animal Feeding Operations,
which will involve development of comprehensive nutrient management plans
(CNMPs) for CAFOs. These are
laudable programs.
However, no integrated
counterpart programs to address air quality from CAFOs have been funded or
developed. As a result, many
operators may have facilities or systems optimized for water quality protection,
but non-optimal with respect to emerging air quality objectives. It will take considerable time,
investment, and a full measure of integrated, coordinated programs of research,
education, training, technical and financial assistance to address air quality
concerns adequately and co-extensively with water quality protection. Recent reactive, enforcement-related
forays to target selected, individual operations with exposure to hazardous
waste regulations designed for industry other than animal agriculture appear
ill-conceived and counter to the systematic development and progressive
implementation of an array of technologies that can ultimately find pervasive
adoption by the CAFO industry of scientifically-sound, appropriate air pollution
control technologies. Just as the
defense sector recognizes that having missiles and knowing when to use them
require two different hierarchies of thinking; the same is true of copious
environmental policies.
Odor Control
Technologies
How
can odor and odorants be satisfactorily controlled? There are four basic approaches, with
multiple technologies that have possibilities within each
approach:
·
Ration/diet manipulation --
reduced protein levels; improved carbohydrate, nitrogen and sulfur utilization;
synthetic amino acid supplementation; improved energy balances; copper
supplementation (swine only); etc.
·
Manure treatment -- aerobic
conditions in surface manure (feedlots); drainage; frequent manure harvesting;
lightly-loaded/facultative lagoons; multiple stage lagoons; surface aeration of
lagoons or storage pits; experimental biochemical amendments;
etc.
·
Capture and treatment of
emitted gases -- reduced liquid manure surface area; wet or dry scrubbers; dust
control; biofilters; lagoon or storage pits covers; chemical oxidant surface
sprays; non-thermal plasma reactors; etc.
·
Enhanced dispersion --
excellent site selection; absence of confining valleys; adequate buffer
distance; tree barriers; deflection walls (air dams); exhaust stacks; dispersion
modeling; etc.
It
should be cautioned that some of these technologies are as yet experimental in
nature, or practical applications may not have been demonstrated. Likewise, selection of control
technologies should be tailored to sources within site-specific circumstances
that include facility design and management factors, climate, topography, and
potential receptors.
Dust Control
Technologies
Likewise, technologies for
particulate (dust) control from open-lot feeding systems are available and
include: frequent manure removal, stocking density adjustment to take advantage
of excreted manure moisture, and where needed water sprinkling. Use of vegetable oil sprays has been
demonstrated for use in swine confinement buildings, and terpenic sprays has
reduced airborne bacterial infections in calf confinement barns. Speciation of CAFO-related dusts in
contrast with ambient dusts from upwind operations (e.g., field dust from crop
production operations) have not been determined
heretofore.
Research Programs Needs:
Health Effects
Worker health from exposure
to dust, odor and odorants inside swine confinement facilities has received most
of the attention regarding health-related issues of CAFOs. Respiratory diseases or conditions are
generally more common among swine confinement building workers than among
cohorts not similarly exposed.
Commonly used design and management practices have been altered
accordingly.
Recent attention has been
paid to health complaints of rural residents neighboring large-scale swine
confinement operations, with preliminary signs of mood states such as tension,
anger, depression, or fatigue showing up recently in community surveys or
epidemiological studies. Hydrogen
sulfide is a suspected contributor.
Linkages, if any, between concomitant control of odor, hydrogen sulfide,
or any other specific gases, should be examined in future
studies.
Research Funding
Levels
Funding levels for air
quality research regarding CAFOs are elusive. While the GAO reported agency
investments in a wide array of animal waste-related research -- USDA-ARS an
average of $5.65 million per year (FY96-99) and USDA-CSREES reportedly $6.9
million in FY97 -- the amounts attributed to air quality were not reported
separately, and are considered a small fraction of these totals. USEPA investments in agricultural air
quality research are not reported and are likely miniscule. Both USDA and USEPA need to come to the
table with enhanced long-term funding packages and programs for agricultural air
quality research and technology transfer that specifically address
CAFOs.
Research and Technology
Transfer Needs: An Assessment
Numerous research and/or
technology transfer needs and opportunities were mentioned in the text of this
report. In brief, these include:
·
Develop accurate and broadly
applicable emission concentrations, rates, and emission factors for PM, odor and
specific odorants applicable to CAFOs;
·
Define emission rates as a
function of diurnal, seasonal, and climatic variations, as well as design and
management practices;
·
Develop effective, practical
odor control technologies for confined animals, treatment, and land application
systems;
·
Determine relationships
among odor, odorants, particulates and airborne microbial
species;
·
Identify kinetic release
mechanisms for odorants and odor from principal manure
sources;
·
Target the development of
control technologies that will specifically address the odor/odorant kinetic
release mechanisms;
·
Develop practical ways,
capable of widespread adoption, of reducing ammonia from CAFOs;
·
Effectively transfer
appropriate technologies for odor control to producers;
·
Develop innovative air
treatment processes for confinement building exhausts or covered lagoon
surfaces;
·
Develop odor reduction
treatments for application immediately prior to land
application;
·
Develop accurate
standardized measurement technologies for odor, odorants of principal concern,
and fine particulate, and ensure these systems become widely available for
research and demonstration; this should include electronic measurement devices
that are well-correlated with the human odor experience;
·
Develop accurate dispersion
models for odor, odorants, and PM appropriate to specific types of CAFOs,
addressing the inherent problems of Gaussian models;
·
Characterize air quality as
a function of distance from large CAFOs;
·
Implement cooperative
industry/agency/university programs for scientific evaluation of new products
for producers’ consideration and adoption;
·
Assess the importance of
indoor air quality at CAFOs and devise ways to reduce exposure
levels;
·
Devise suitable
acceptability criteria for community-level exposure to odor and specific
associated gases;
·
Assess potential
relationships between emission constituents, concentrations, and potential
health indicators, and devise appropriate mitigation strategies
accordingly;
·
Monitor studies by
traditional health organizations and centers and identify implications for the
CAFO industry, developing partnerships to proactively address any identified
issues.
Programmatic, Industry, and
Community Relationships: A Discussion
In
summation, air quality agencies need to recognize that the U.S. excels and will
continue to excel in animal agriculture.
Industry consolidation is a response both to securing positions of high
productivity and adjusting to widely-recognized and increasing environmental
protection responsibilities.
Producers need to recognize that those technologies that were optimized
for water quality protection may now seem insufficient for protecting air quality, which tends to be even more
regionalized in terms of problems and solutions. Margins of community acceptance that
were present when animal feeding operations were dispersed and small (by today’s
standards) with individual farmer ownership may no longer exist as operations
grow by orders of magnitude and become more complex in structure. Nor will relatively straight-forward
technologies for controlling water pollution likely be considered adequate for
the more complex air quality issues.
Fortunately, there are promising technologies either available or being
developed that can significantly reduce emissions of odor, odorants, or dusts,
as appropriate. None of these
technologies are free or even especially cheap; but neither are alternative
legal remedies. Partnerships among
industry, agencies, universities, research and technology transfer institutions,
and the public will be the best and longest-lasting means of abating CAFO air
quality problems that exist in parts of the country or in isolated
instances. The nation remains far
under-invested in development of technologies to assess and abate air
contaminants from CAFOs, and as such seems in danger of reacting inappropriately
with policies that are far ahead of the science or industry’s ability to adapt
in a timely fashion.
A program of accelerated
research, education, technical training, technology transfer, and financial
assistance to cope with CAFO air quality problems is strongly recommended. The USDA Agricultural Air Quality Task
Force, established under the 1996 Farm Bill, has a stake in designing and
fostering the implementation of these proactive, progressive
programs.
References
AAQTF. 1998. Report of the Research Committee. USDA Agricultural Air Quality Task
Force, Washington D. C.
Achterstraat, J. and D.
Spoorenberg. 1997. Dietary Protein Content and Ammonia
Emission from Growing-Finishing Pigs.
M.S. Thesis Dissertation.
Wageningen Agricultural University, Wageningen, NL.
Algeo, J. W., C. J. Elam, A.
Martinez, and T. Westing. 1972. How
to Control Feedlot Pollution: Bulletin D.
California Cattle Feeders Association, Bakersfield,
California.
ASAE. 1999a. Control of Manure Odors. ASAE EP-379.2. ASAE Standards - 1999,
46th ed. American Society of Agricultural Engineers. St. Joseph, MI. pp. 655-657.
ASAE. 1999b. Design of Anaerobic Lagoons for Animal
Waste Management. Engineering
Practice EP 403.3, ASAE Standards - 1999, (46th ed.) American
Society of Agricultural Engineers, St. Joseph, MI. pp 674-678.
ASAE. 1999c. Uniform Terminology for Rural Waste
Management. Standard S292.5,
ASAE Standards - 1999, (46th ed.) American Society of
Agricultural Engineers, St. Joseph, MI.
pp 636-639.
ASTM. 1975. Standard Practices for Referencing
Suprathreshold Odor Intensity.
E544-75, Philadelphia, PA, ASTM Committee E-18.
ASTM. 1991. Standard Practice for Determination of
Odor and Taste Thresholds by a Forced Choice Ascending Concentration Series
Method of Limits. E679-91, 1991
Annual Book of Standards, American Society of Testing and Materials,
Philadelphia, PA. 8
p.
Aneja, V. P., I. P. Cauhan,
and J. T. Walker. 2000a. Characterization of Atmospheric Ammonia
Emissions from Swine Waste Storage and Treatment Lagoons. Journal of Geophysical Research,
105(D9):11,535-11,545.
Aneja, V. P., P. A. Roelle,
G. C. Murray, J. Southerland, J. W. Evisman, D. Fowler, W. A. H. Asman, and N.
Patni. 2000b. Workshop Summary and Assessment. Proceedings, Atmospheric Nitrogen
Compounds II: Emissions, Transport, Transformation, Deposition and
Assessment. Capel Hill, NC. June 7-9. pp i-xxv.
Arogo, J., R. H. Zhang, G.
L. Riskowski, and D. L. Day.
1999. Mass Transfer
Coefficient for Hydrogen Sulfide Emission from Aqueous Solutions and Liquid
Swine Manure. Transactions of
the American Society of Agricultural Engineers. 42(5):1455-1462.
Ashbaugh, L., N. Freitas, T.
James, R. Flocchini. 1998. Ammonia Emissions from a Large Dairy in
California’s San Joaquin Valley.
Proceedings of A&WMA Specialty
Conference "Emission Inventory: Living in a Global Environment." New Orleans, LA. December. 7 pages.
Asman, W. A. H. 1992. Ammonia Emissions in Europe: Updated
Emission and Emission Variations.
National Institute of Public Health and Environmental Protection. Bilthoven, The Netherlands. May.
Atwood, S. and B.
Kelly. 1996. Study Sheds Light on Dairies
Contribution to Air Pollution.
South Coast Air Quality Management District, California. March 21. 2 p.
Auvermann, B. W. 2000. Personal Communication. Texas A&M University Agricultural
Research and Extension Center, Amarillo, Texas. May 10.
Baidoo, S. K. 2000. Environmental Impacts of Swine, Poultry
Nutrition Discussed.
Feedstuffs. June
26. pp.
12-14.
Baird, F. C. 1993. Water Budget and Nutrient Balance
Worksheet. USDA Soil Conservation
Service, Temple, Texas. Presented
at the Livestock and Poultry Manure Management Conference, Austin, Texas,
February 10-11, 19 p.
Barnebey-Cheney. 1987. Scentometer: An Instrument for Field
Odor Measurement. Bulletin T-748,
Barnebey-Cheney Activated Carbon and Air Purification Equipment Co., Columbus,
Ohio. January. 3 p.
Barrington,
S. 1995. Odor Measurement, Commercial Substrates
and Biofilters. In: International
Round Table on Swine Odor Control, pp. 40-45. Ames, Iowa, Iowa State
University.
Barth, C. L., L. F. Elliot,
and S. W. Melvin. 1984. Using Odor
Control Technology to Support Animal Agriculture. Transactions of the
American Society of Agricultural Engineers. 27 (3): 859-864.
Battye R., W. Battye, C.
Overcash, and S. Fudge. 1994. Development and Selection of Ammonia
Emission Factors: Final Report.
EC/R Inc., Durham, NC. EPA
Contract Report #68-D3-0034, U. S. Environmental Protection Agency, Research
Triangle Park, NC. 111
p.
Berckmans, D., J. Q. Ni, J.
Roggen, G. Huyberechts. 1992. Testing an Ammonia Sensor for Livestock
Buildings. Paper No. 92-4522,
Presented at the International Winter Meeting of the American Society of
Agricultural Engineers, Nashville, TN.
December 15-17. 21
p.
Bicudo, J. R., L. D.
Jacobson, K. A. Janni, H. Guo, and C. L. Tengrran. 2000. Odor and Hydrogen Sulfide Emissions
During Agitation and Pumping of Stored Dairy and Swine Manure in Minnesota. Paper No. 004049, 2000 ASAE
International Meeting, Milwaukee, WI. American Society of Agricultural
Engineers, St. Joseph, MI. 8
p.
Brewer, S. K. and T. A.
Costello. 1999. In-Situ Measurement of Ammonia
Volatilization from Broiler Litter Using an Enclosed Air Chamber.
Transactions of the American Society of Agricultural Engineers. 42(5):1415-1422.
Buch,
U. M., C. B. Parnell, Jr., and B. W. Shaw.
1998. A Comparison of
Particle Size Distributions from the Coulter Multisizer, the Cascade Impactor
and the FRM PM2.5 Sampler.
Paper No. 984065, Presented at the 1998 ASAE Annual International Meeting
in Orlando, FL. American Society of
Agricultural Engineers, St. Joseph, MI.
Buch,
A. M., C. B. Parnell, Jr., B. W. Shaw, and B. Auvermann. 1999. Performance Test Results from Two
PM2.5 Samplers and the Cascade Impactor. Paper No. 994193, Presented at the 1999
ASAE Annual International Meeting in Toronto, Canada. American Society of Agricultural
Engineers, St. Joseph, MI.
Buharivala,
P. 1998. Emission Factors for Feed Mills. Unpublished Dissertation. Department of Agricultural Engineering,
Texas A&M University. College
Station, TX.
Buijsman, E., H. F. M. Maas,
W. A. H. Asman. 1987. Anthropogenic NH3 Emissions in
Europe. Atmospheric
Environment, Volume 21, No. 5:1009-1022. Great Britain.
Bulley, N. R. and D.
Phillips. 1980. Sensory Evaluation of Agricultural
Odors: A Critical Review.
Canadian Agricultural Engineering,
22(2):107-112.
Burnett, W. E. 1969. Qualitative Determination of the Odor
Quality of Chicken Manure. In: Odors, Gases and Particulate Matter from
High Density Poultry Management Systems as They Relate to Air Pollution Final
Report, Department of Agricultural Engineering, Cornell University. Contract No. C-1101. pp. 2-17.
Canh, T. T., A. L. Sutton,
A. J. A. Aarnink, M. W. A. Vertegen and G. C. M. Bakker. 1998. Dietary Carbohydrates Alter the Fecal
Composition and pH and the Ammonia Emission from Slurry of Growing Pigs. Journal of Animal Science. 76:1887-1895.
CARB. 1999. Estimates of Ammonia Emissions from Beef
and Dairy Cattle in California.
Review Draft. California Air
Resources Board, Sacramento, CA.
November 19. 38
p.
Cheng, J., K. F. Roos, and
L. M. Saele. 1999. Covered Anaerobic Lagoon System for
Swine Waste Treatment of Energy Recovery.
Paper #994048, 1999 ASAE/CSAE International Meeting, Toronto. American Society of Agricultural
Engineers. St. Joseph, MI. 10 p.
Clanton, C. J. D. R.
Schmidt, L. D. Jacobson, R. E. Nicolai, P. R. Goodrich, and K. A. Janni. 1999a. Swine Manure Storage Covers for Odor
Control. Applied Engineering in
Agriculture.
15(5):567-572.
Clanton, C. J., D. R.
Schmidt, R. E. Nicolai, P. R. Goodrich, L. D. Jacobson, K. A. Janni, S.
Weisbert, and J. A. Buckel.
1999b. Dynamic Olfactometry
Variability in Determining Odors Dilution to Threshold. Transactions of the
American Society of Agricultural Engineers. 42(4):1103-1112.
Classen, J. J., J. S. Young,
R. W. Bottcher, and P. W. Westerman.
2000. Design and Analysis of
a Pilot Scale Biofiltration System for Odorous Air. Transactions of the
American Society of Agricultural Engineers. 43(1):111-118.
Clausnitzer,
H. and M. J. Singer. 1996. Respirable-Dust Production from
Agricultural Operations in the Sacramento Valley, California. Journal of Environmental Quality,
Vol. 25(4):877-884).
Cole, N. A. and D. B.
Parker. 1999. Personal Communication. USDA- Agricultural Research Service,
Bushland, Texas and West Texas A&M University, Canyon,
Texas.
Demny,
M. A., B. W. Shaw, and C. B. Parnell, Jr.
1997. Evaluating Emissions
from Feed Mills Associated with Cattle Feedyards. ASAE Paper No. 974096, Presented at the
1997 Annual International Meeting in Minneapolis, MN. American Society of Agricultural
Engineers, St. Joseph, MI.
Donham,
K. J., L. J. Scallon, W. Popendorf, M. W. Treuhaft, and R. C. Roberts. 1986. Characterization of Dusts Collected from
Swine Confinement Buildings. Am.
Ind. Hyg. Assoc. J. 47: 404-410.
Donham,
K. J., P. Haglind, Y. Peterson, R. Rylander, and L. Belin. 1989. Environmental and Health Studies of Farm
Workers in Swedish Swine Confinement Buildings. British J. Ind. Med. 46:
31-37.
Donham,
K. J., S. F. Reynolds, P. Whitten, J. Merchant, L. Burmeister, and W. J.
Popendorf. 1995. Respiratory Dysfunction in Swine
Production Facility Workers: Dose-Response Relationships of Environmental
Exposures and Pulmonary Function.
American Journal of Industrial Medicine 27:405-418.
Dravnieks,
A. and W. H. Prokop. 1975. Source Emission Odor Measurement by a
Dynamic Forced-Choice Triangle Olfactometer. Journal of the Air Pollution Control
Association,
25(1):28-35.
Drochner, W. 1987. Aspects of Digestion in the Large
Intestine of the Pig. Advanced
Animal Physiology and Animal Nutrition. 82 pp.
Eaton, D. L. 1996. Swine Waste Odor Compounds. Pioneer Hi-Bred International, Livestock
Environmental Systems, Des Moines, Iowa.
14p.
Elam C. J., J. W. Algeo, T.
Westing, and L. Hokit. 1971. Measurement and Control of Feedlot
Particulate Matter. Bulletin C. How
to Control Feedlot Pollution.
California Cattle Feeders Association, Bakersville, CA. January.
Elliot, L. F., J. W. Doran,
and T. A. Travis. 1978. A Review of Analytical Methods for
Detecting and Measuring Malodors from Animal Wastes. Transactions of the
American Society of Agricultural Engineers. 21(1):130-135.
EPA. 1986. Measurement of Gaseous Emission Rates
from Land Surfaces Using an Emission Isolation Flux Chamber, Users Guide. U. S. Environmental Protection Agency,
Environmental Monitoring Systems Laboratory, Las Vegas,
Nevada.
EPA. 1995. Compilation of air pollutant emission
factors, Volume I: Stationary point and area sources, Fifth edition. January 1995. U.S. EPA Office of Air Quality Planning
and Standards, Research Triangle Park, NC.
EPA. 1999. Interim Guidance on the CERCLA Section
101(10)(H) Federally Permitted Release Definition for Certain Air Emissions:
Notice. Federal
Register.
64(244):71614-71620.
Freitas, N., T. James, and
L. Ashbaugh. 1997. Preparation and Sampling Technique for a
Passive Ammonia Diffusion Sampler.
In: Ammonia and Odour Control from Animal Production Facilities, J. A. M.
Voermans and G. Monteny (eds).
Dutch Society of Agricultural Engineering (NVTL), Rosmalen, The
Netherlands. pp
591-594.
Frolov,
A. 1997. The use of Terpenoids for Air Sanitation
in Livestock Buildings. Vyestsi Akademii Ahrarnykh Navuk Respubliki
Byelarus. Vol.
0(1):59-62.
GAO. 1999. Animal Agriculture: Waste Management
Practices. Report to the Honorable
Tom Harkin, GAO/RCED-99-205. U.S.
General Accounting Office, Washington D.C.
July. 40
p.
Gates. R. S., A. J.
Pescatore, J. Taraba, A. H. Cantor, K. Liberty, M. J. Ford, and D. J.
Burnham. 2000. Dietary Manipulation of Crude Protein
and Amino Acids for Reduced Ammonia Emission from Broiler Litter. Paper No. 004024, Presented at the ASAE
International Meeting, Milwaukee, WI, July 9-12. ASAE, St. Joseph, MI.15
p.
Gharib, S. and G. R.
Cass. 1984. Ammonia Emissions in the South Coast Air
Basin 1984. Open File Report 84-2,
Environmental Quality Laboratory, California Institute of Technology. Pasadena, CA.
Goihl, J. 2000. Supplemental Copper Can Improve Odor
Characteristics of Swine Feces. Feedstuffs. June 26. pp. 11 & 19.
Goodrich, P. R. Y. Wang, H.
Ma, S. Deng, and R. R. Ruan.
1999. Odor Destruction Using
a Barrier Discharge Reactor. Paper
No. 994034, 1999 ASAE/CASE International Meeting, Toronto. American Society of
Agricultural Engineers, St. Joseph, MI.
9 p.
Greene, L. W. 2000. Personal Communication. Texas A&M University Agricultural
Research and Extension Center, Amarillo, TX. June 30.
Grelinger, M. A. and T.
Lapp. 1996. An evaluation of published emission factors for cattle feedlots.
Presented at the 1996 International Conference on Air Pollution from
Agricultural Operations. Kansas City, MO. American Society of Agricultural
Engineers, St. Joseph, MI.
Guarino, M., A. Casoli, and
P. Navarotti. 1999. Dust Concentration and Mortality
Distribution in an Enclosed Laying House. Transactions of the American
Society of Agricultural Engineers.
42(4):1127-1133.
Hammond, E. G., P. Kuczala,
G. A. Junk, and J. Kozel.
1974. Constituents of Swine
House Odors. In: Livestock Environment,
Proceedings of the International Livestock Environment Symposium, American
Society of Agricultural Engineers, St. Joseph, MI. April 17-19. P. 364-372.
Hammond, E. G. and R. J.
Smith. 1981. Survey of Some Molecularly Dispersed
Odorous Constituents in Swine-House Air.
Iowa State Journal of Research, 55(4): 393-346.
Harrison, J. 2000. Summary Comments. Presented at USEPA and USDA Ammonia
Workshop, Beltsville, MD, March 21-24.
2p.
Hartung,
J. 1994. The Effect of Airborne Particulates on
Livestock Health and Production. In
I.Ap Dewi, R. F. E. Axford, I. F. M. Marai, and H. Omed (eds), Pollution in
Livestock Production Systems, pp 55-69. Wallingford, CAB
International.
Heber,
A. J., M. Stroik, J. M. Faubion, and L. H. Willard. 1988a. Size Distribution and Identification of
Aerial Dust Particles in Swine Finishing Buildings. Transactions of the American
Society of Agricultural Engineers. 31:
882-887.
Heber,
A. J., M. Stroik, J. L. Nielsen, and D. A. Nichols. 1988b. Influence of Environmental Factors on
Concentrations and Inorganic Content of Aerial Dust in Swine Finishing
Buildings. Transactions of the American
Society of Agricultural Engineers. 31:
875-881.
Heber,
A. J., D. S. Bundy, T. T. Lim, J. Q. Ni, B. L. Haymore, C. A. Diehl, and R. K.
Duggirala. 1998. Odor Emission Rates from Swine
Confinement Buildings. In: Animal
Production Systems and the Environment.
Proceedings, International Conference on Odor, Water Quality, Nutrient
Management, and Socioeconomic Issues, Des Moines, IA. July 20-22. pp 305-310.
Heber
A. J. and M. J. Heyne. 1999. Outdoor Hydrogen Sulfide Concentrations
Near a Swine Feeding Facility.
Paper No. 994006, 1999 ASAE/CSAE International Meeting, Toronto. American Society of Agricultural
Engineers, St. Joseph, MI. 14
p.
Heber,
A. J. and J. Q. Ni. 1999. Odor Emission from a Swine Finishing
Facility with a Surface-Aerated Lagoon.
Paper No. 99-4129, Presented at 1999 ASAE/CSAE International meeting,
Toronto. American Society of
Agricultural Engineers, St. Joseph, MI.
23 p.
Herber,
D. and C. B. Parnell. 1988. Comparison of PM10 and
High-Volume Air Samplers Using a Coulter Counter Particle Size Analyzer. Paper No. SWR 88-109. Presented at 1988 Southwest Region
Meeting of ASAE, Lubbock, TX.
Hobbs,
P. 1995. Measurement of Swine Odor Using
Electronic Nose Technology. In:
International Round Table on Swine Odor Control, pp. 36-39. Ames, Iowa, Iowa State
University.
Hoff,
S. J., D. S. Bundy, and X. W. Li.
1997. Dust Effects on Odor
and Odor Compounds. Proceedings of
the International Symposium Ammonia and Odour Control from Animal Production
Facilities, Vinkeloord, The Netherlands, October 6-10. pp 101-110.
Hutchinson, G. L., A. R.
Mosier, and C. E. Andre. 1982.
Ammonia and Amine Emissions from a Large Cattle Feedlot. Journal of Environmental Quality,
11(2): 288-293.
Ishmael, W. 2000. The Stink Over Ammonia. Beef Feeder. April. pp. 10-12.
Ison,
C. 1998. State Air Test Find High Levels of Toxic
Gas Near 5 Feedlots. Star Tribune,
April 26. Minneapolis,
Minnesota.
Jacobson,
L. D., R. E. Nicolai, and D. R. Schmidt.
1997. Odor Concerns for
Animal Production Systems.
University of Minnesota.
James,
T., N. Freitas, L. Ashbaugh, and D. Meyer.
1997. Field Estimates of
Ammonia Volatilization from Cattle Production Facilities. In: Emission Inventory: Planning for the
Future, Air & Waste Management Association. Pittsburgh, PA. Pp 259-267.
James,
T., D. Meyer, E. Esparza, E. Depeters, H. Perez-Monti. 2000. Effects of Dietary Nitrogen Manipulation
on Ammonia Volatilization from Manure from Holstein Heifers. Journal of Dairy Science, in
press.
Jones, M. 1992. Odour Measurement Using Dynamic
Olfactometry. In: Odour Update 92: Proceedings of a Workshop on
Agricultural Odors. MRC Report No.
DAQ 64/24, Department of Primary Industries, Toowoomba, QLD. April. pp. 17-32.
Keck, M. 1997. Ammonia Emission and Odour Thresholds of
Cattle Houses with Exercise Yards.
In: Proceeding, Ammonia and Odour Control from Animal Production
Facilities, International Symposium, Vinkelord, The Netherlands, 6-10
October.
Keller, K. H. and R. W.
Ball. 2000. A Retrospective Study of Diarrheal and
Respiratory Illness Incidence Rates in Milford, Utah 1992-1998. Environmental Epidemiology Program,
Bureau of Epidemiology, Utah Department of Public Health.
Kelly, J.P. 1995. Ammonia and Odour Emissions from
Agricultural Sources: A Review.
Faculty of Engineering and Surveying, University of Southern Queensland,
Toowoomba, Queensland, Australia.
57p.
Kendall, D. C., K. M.
Lemenager, B. T. Richert, A. L. Sutton, J. W. Frank and B. A. Belstra. 1998. Effects of Intact Protein Diets Versus
Reduced Crude Protein Diets Supplemented with Synthetic Amino Acids on Pig
Performance and Ammonia Levels in Swine Buildings. Journal of Animal Science. 76 (Suppl. 1):173. (Abstr.)
Kendall, D. C., B. T.
Richer, A. L. Sutton, J. W. Frank, S. A. DeCamp, K. A. Bowers, D. Kelly, and M.
Cobb. 1999. Effects of Fiber Addition (10% Soybean
Hulls) to a Reduced Crude Protein Diet Supplemented with Synthetic Amino Acids
Versus a Standard Commercial Diet on Pig Performance, Pit Composition, Odor and
Ammonia Levels in Swine Buildings.
Journal of Animal Science.
77 (Suppl):176.
(Abstract).
Lacey, R. E. 1998. Characterization of Swine Production
Odors by an Electronic Nose. Final
Report, Texas A&M University and National Pork Producers Council, Des
Moines, IA. 12
p.
Li, X. W., D. S. Bundy, and
S. J. Hoff. 1997. Developing an Olfactometer for Livestock
Odor Evaluation. In: Proceedings of
the International Symposium on Ammonia and Odour Control from Animal Production
Facilities, Vinkeloord, The Netherlands.
October 6-10. pp.
155-160.
Lim, T. T., A. J. Heber, J.
Q. Ni, R. Duggirala, and C. A. Diehl.
1998. Production of Carbon
Dioxide in a Deep-Pit Swine Finishing House. Paper No. 984049, 1998 ASAE
International Meeting, Orlando, FL. American Society of Agricultural Engineers,
St. Joseph, MI. 15
p.
Lim, T. T., A. J. Heber, and
J. Q. Ni. 1999. Odor Emissions from Commercial Swine
Nurseries. Paper No. 994147,
presented at 1999 ASAE/CSAE International Meeting, Toronto. American Society of Agricultural
Engineers, St. Joseph, MI. 12
p.
Lim, T. T., A. J. Heber, and
J. Q. Ni. 2000. Odor and Gas Emissions from Anaerobic
Treatment of Swine Waste. Paper No.
004081, Presented at 2000 ASAE International Meeting, Milwaukee, WI. American
Society of Agricultural Engineers, St. Joseph, MI. 13 p.
Lindvall, T., O. Noren, and
L. Thyrelius. 1974. Odor Reduction for Liquid Manure
Systems. Transactions of the American Society of Agricultural
Engineers.
17(3):508-512.
Luebs, R. E., K. R. Davis,
and A. E. Laag. 1974. Diurnal Fluctuation and Movement of
Atmospheric Ammonia and Related Gases from Dairies. Journal of Environmental Quality,
3(3):
265-269.
Lwo, J. H. 1995. Swine Odor Control Methods in
Taiwan. In: International Round
Table on Swine Odor Control, pp. 77-80.
Ames, Iowa, Iowa State University.
Mackay-Sim, A. 1992. Electronic Odour Detection-Problems and
Possibilities. In: Odour Update '92: Proceedings of a Workshop on
Agricultural Odours. MRC Report No. DAQ 64/24, Department of Primary Industries,
Toowoomba, QLD. April. pp.
57-61.
Mackie,
R. I. 1995. Microbial Production of Odor
Components. In: International Round
Table on Swine Odor Control, pp. 18-19.
Ames, Iowa, Iowa State University.
Mackie,
R. I., P. G. Stroot, and V. H. Varel.
1998. Biochemical
Identification and Biological Origin of Key Odor Components in Livestock
Waste. Journal of Animal Science. 76:1331-1342.
MacVean,
D. W., D. K. Franzen, T. J. Keefe, and B. W. Bennett. 1986. Airborne Particulate Concentration and
Meteorologic Conditions Associated with Pneumonia Incidence in Feedlot
Cattle. American Journal of Veterinary Research. 47(12), 2676-82.
Maghirang,
R. G., G. L. Riskowski, L. L. Christianson, and H. B. Manbeck. 1995. Dust Control Strategies for Livestock
Buildings - A Review. ASHRAE
Transactions. 101:
1161-1168.
Maghirang,
R. G., M. C. Puma, Y. Liu, and P. Clark.
1997. Dust Concentrations
and Particle Size Distribution in an Enclosed Swine Nursery. Transactions of the American
Society of Agricultural Engineers. 40: 749-754.
Maghirang,
R. G. and M. C. Puma. 1997. Airborne and Settled Dust Levels in a
Swine House. ASHRAE
Transactions. 103:
309-315.
McFarland, A. M. S. 1995. Dispersion Modeling of Odor Transport
from Open Lot Dairies. In:
Proceedings, Odors: Indoor and Environmental Air, Air Waste Management
Association Conference, Bloomington, MN.
13p.
McFarland, A. M. S. and J.
M. Sweeten. 1995. Odor Measurement: Applications to
Livestock Feeding Facilities. In:
Innovations and New Horizons in Livestock and Poultry Manure Management. Texas A&M University System. pp 149-159.
McGee,
R. O. 1997. A Critical Analysis of the AP-42
Emission Factor for Cattle Feedyards.
Unpublished Master of Engineering Report. Department of Agricultural Engineering,
Texas A&M University. College
Station, Texas.
Meister,
M., B. Fritz, G. Zwicke, B. W. Shaw, B. Auvermann, and C. B. Parnell, Jr. 1999. Dispersion Modeling from Ground Level
Area Sources. Proceedings of the
1999 Beltwide Cotton Production Conferences, National Cotton Council. Memphis, TN.
Miner, J. R. 1974. Odors from Confined Livestock
Production. EPA660/2-74-023. U.S. EPA, Washington, D.C., 124
p.
Miner, J. R. 1975a. Evaluation of Alternative Approaches to
Control of Odors from Animal Feedlots.
Idaho Research Foundation, Moscow, Idaho.
Miner, J. R. 1975b. Management of Odors Associated with
Livestock Production. In: Managing Livestock Wastes,
Proceedings of Third International Symposium on Livestock Wastes. American Society of Agricultural
Engineers. St. Joseph, MI. pp. 378-380.
Miner, J. R. and R. C.
Stroh. 1976. Controlling Feedlot Surface Odor
Emission Rates by Application of Commercial Products. Transactions of the American Society
of Agricultural Engineers.
19(3):533-538.
Miner, J. R. 1995. A Review of the Literature on the Nature
and Control of Odors from Pork Production Facilities: An Executive Summary. National Pork Producers Council, Des
Moines, Iowa. 22
p.
Montes, F. and J. P.
Chastain. 2000. Ammonia Volatilization Losses During
Irrigation of Liquid Manure in Commercial Forestland and Open Field
Conditions. Paper No. 004021, 2000
ASAE International Meeting, Milwaukee, WI.
American Society of Agricultural Engineers, St. Joseph, MI. 7 p.
Moore, P. A., T. C. Daniel,
D. R. Edwards, and D. M. Miller.
1995. Effect of Chemical
Amendments on Ammonia Volatilization from Poultry Litter. Journal of Environmental Quality,
24:293-300.
National Research
Council. 1979. Odors from Stationary and Mobile
Sources. National Academy of
Sciences, Washington, D.C. 491 p.
Ni, J.
Q., A. J. Heber, T. T. Lim, R. K. Duggirala, and B. L. Haymore. 1998. Ammonia Emission From a Large
Mechanically-Ventilated Swine Building During Warm Weather. Paper No. 984051, 1998 ASAE
International Meeting, Orlando, FL.
American Society of Agricultural Engineers, St. Joseph, MI. 16 p.
Ni, J.
Q., A. J. Heber, T. T. Lim, and C. A. Diehl. 1999a. Continuous Measurement of Hydrogen
Sulfide Emission from Two Large Swine Finishing Buildings. Paper No. 994132, Presented at the 1999
ASAE/CSAE International Meeting, Toronto.
American Society of Agricultural Engineers, St. Joseph, MI. 15 p.
Ni, J.
Q., A. J. Heber, T. T. Lim, C. A. Diehl, A. L. Sutton, R. K. Duggirala, B. L.
Haymore, and V. I. Adamchuck.
1999b. Effect of a Manure
Additive on the Reduction of Ammonia Emission from Large Swine Finishing
Buildings. Paper No. 994032, 1999
ASAE/CSAE International Meeting, Toronto.
American Society of Agricultural Engineers, St. Joseph, MI. 13 p.
Ni, J.
Q., A. J. Heber, K. J. Fakhoury, P. Shao, A. L. Sutton, D. Kelley, J. A.
Patterson, and S. T. Kim.
2000. Laboratory Measurement
of Hydrogen Sulfide and Sulfur Dioxide Releases from Swine Manure of Different
Solids Content. Paper No. 004082,
2000 ASAE International meeting, Milwaukee, WI. American Society of Agricultural
Engineers, St. Joseph, MI. 13
p.
Nicolai, R. E., L. D.
Jacobson, D. R. Schmidt, and C. McGinley.
1997. Livestock Odor Measurement Using a Venturi Olfactometer and Odor
Sampling Using Cloth Swatches. In:
Proceedings of the International Symposium on Ammonia and Odour Control from
Animal Production Facilities, Vinkeloord, The Netherlands. October 6-10. pp. 193-196.
O’Halloran, I. P. 1993. Ammonia volatilization from liquid hog
manure: Influence of Aeration and Trapping Systems. Soil Science Society of
America. 47:
1300-1303.
O’Neill,
D. H. and V. R. Phillips. 1992.
A Review of the Control of Odor
Nuisance from Livestock Buildings: Part 3, Properties of the Odorous Substances
Which Have Been Identified in Livestock Wastes or in the Air Around Them. Journal of Agricultural Engineering
Research. 34:23-50.
Oosthoek, J. and W.
Kroodsma. 1990. Ammonia Emission Reduction from
Cowsheds. In: Agricultural and
Food Processing Waste (Proceedings of the 6th International Symposium on
Agricultural and Food Processing Wastes).
American Society of Agricultural Engineers. pp. 442-448.
Pain, B. F., Y. J. Rees, and
D. R. Lockyer. 1988. Odour and Ammonia Emission Following the
Application of Pig or Cattle Slurry to Land. In: Volatile Emissions from Livestock
Farming and Sewage Operations.
(V. C. Nielsen, J. H. Voorburg, and P. L. Hermite, Eds.). Elsevier Applied Science, London and New
York. pp.
2-11.
Parnell,
C. B. 1992. Complying with the Federal Clean Air
Act. ASAE Paper No. 921038,
Presented at the Winter Meeting of the American Society of Agricultural
Engineers, St. Joseph, MI.
December.
Parnell, S. E., B. J.
Lesikar, J. M. Sweeten, and B. T. Weinheimer. 1993. Dispersion modeling for prediction of
emission factors. Paper No. 934554
presented at the 1993 International Winter Meeting sponsored by the American
Society of Agricultural Engineers, Chicago, IL. American Society of Agricultural
Engineers, St. Joseph, Mi.
Parnell, S. 1994. Dispersion Modeling for Prediction of
Emission Factors for Cattle Feedyards.
Unpublished Master of Science Thesis. Department of Agricultural Engineering,
Texas A&M University. College
Station, TX.
Parnell, S. E., B. J.
Lesikar, J. M. Sweeten, and B. T. Weinheimer. 1995. Dispersion modeling for prediction of
emission factors from cattle feedyards.
Texas Agricultural Extension Service, Texas A&M University System,
Report for Environmental Protection Agency, Research Triangle Park, NC. Department of Agricultural Engineering,
Texas A&M University, College Station, TX.
Parnell,
C. B. Jr., P. J. Wakelyn.
1996. Regulation of
Agricultural Operations Using Emission Factors and Process Weight Tables. Paper presented at the 1996
International Conference on Air Pollution from Agricultural Operations, Kansas
City, MO, and published in the proceedings of the 1996 Beltwide Cotton
Production Conference, National Cotton Council, Nashville,
TN.
Parnell,
C. B. Jr. and P. J. Wakelyn.
1999. Physical
Characteristics of Particulate Matter and Health Effects. Proceedings of the 1999 Beltwide Cotton
Production Conferences. National
Cotton Council, Memphis, TN.
Parnell, C. B. Jr., B. W.
Shaw, B. W. Auvermann. 1999. Agricultural Air Quality Fine Particle
Project - Task 1: Livestock -
Feedlot PM Emission Factors and Emissions Inventory Estimates Final Report.
Research funded by Texas Natural Resource Conservation Commission. Department of
Agricultural Engineering, Texas A&M University, College Station,
TX.
Peters, J. A. and T. R.
Blackwood. 1977. Source Assessment: Beef Cattle Feedlots. EPA-600/ 2-77-107, U.S. Environmental Protection Agency,
Research Triangle Park, NC. June.
101 p.
Phillips, V. R., M. R.
Holden, R. P. White, R. W. Sneath, T. G. M. Demmers, and C. M. Wathes. 1995. Measuring and Reducing Gaseous and
Particulate Air Emissions from U.K. Livestock Buildings. In: Proceedings, 7th International
Symposium on Agricultural and Food Processing Wastes (C.C. Ross, ed.), American
Society of Agricultural Engineers, St. Joseph, MI. pp. 241-251.
Pickrell,
J. A., A. J. Heber, J. P. Murphy, S. C. Henry, M. M. May, D. Nolan, F. W. Oehme,
D. Schoneweis. 1993. Characterization of Particles, Ammonia,
and Total Respirable Dust and Endotoxin in Swine Confinement Buildings. Vet. Human Toxicol. 35:
421-428.
Raina,
M. and C. B. Parnell. 1994. Determination of PM10
Concentrations from the TSP Data Using the Coulter Counter Multi Sizer. Paper No. 94-4537. American Society of
Agricultural Engineers, St. Joseph Michigan.
Reynolds.
S. J., K. J. Donham, P. Whitten, J. A. Merchant, L. F. Burmeister, and W. J.
Popendorf. 1996. Longitudinal Evaluation of Dose-Response
Relationships for Environmental Exposures and Pulmonary Function in Swine
Production Workers. American
Journal of Industrial Medicine 29:33-40.
Riskowski,
G. L., R. G. Maghirang, T. L. Funk, L. L. Christianson, and J. B. Priest. 1998. Environmental Air Quality in Production
Animal Housing Facilities - A Review and Evaluation of Alternative Ventilation
Strategies. ASHRAE Transactions
104: 104-113.
Romanillos,
A. and B. W. Auvermann. 1999. Effect of Stocking Density on Fugitive
PM10 Emissions from a Cattle Feedyard. Paper No. 99-4192, Presented at 1999
ASAE Annual International Meeting, Toronto, Ontario, Canada. 10 p.
Rosen,
K. G. and G. Richardson. 1999. Would Removing Indoor Air Particulates
in Children's Environments Reduce Rate of Absenteeism - A hypothesis. Science of the Total
Environment. Vol.
234(1-3):87-93.
Safley, L. M. and P. W.
Westerman. 1990. Psychrophilic Anaerobic Digestion of
Dairy Cattle Manure. In: Agricultural and Food Processing
Wastes. Proceedings of the
6th International Symposium on Agricultural and Food Processing
Wastes, American Society of Agricultural Engineers, St. Joseph, MI. pp. 250-258.
Safley, L. M., M. E. Casada,
J. W. Woodbury, and K. F. Roos.
1992. Global Emissions from
Livestock and Poultry Manure.
Report No. EPA 1400/1-91/048.
U. S. Environmental Protection Agency, Washing D.C.. 145 p.
Schiffman, S., E. A. S.
Miller, M. S. Suggs, and B. G. Graham.
1995. The Effect of
Environmental Odors Emanating from Commercial Swine Operations on the Mood of
Nearby Residents. Brain Research
Bulletin 37(4):369-375.
Schiffman,
S., E. A. S. Miller, M. S. Suggs, and B. G. Graham. 1998. Mood Changes Experienced by Persons
Living Near Commercial Swine Operations.
In: Thu, K. and E. P. Durrenberger (eds), Pigs, Profits, and Rural
Communities, pp. 84-102. Albany,
New York, State University of New York Press.
Schmidt,
C. E., J. Lester, and E. Winegar.
1997. Assessment of PM10
Precursor Air Emissions from Dairy Industry Livestock Waste in Southern
California. Journal of Air and Waste Management
Association. In review.
Schmidt,
D. R., J. R. Bicudo, and K. Janni.
1999. Determining Odor
Emissions from Manure Surfaces Using a Wind Tunnel. Paper No. 994033, 1999 ASAE/CSAE
International Meeting, Toronto. American Society of Agricultural Engineers, St.
Joseph, MI. 8
p.
Schulte,
D. D. 1997. Critical Parameters for Emissions. In: (J. Voermans and G. J. Montery,
eds). Proceedings, Ammonia and
Odour Emissions from Animal Production Facilities. NVTL Publishing, Rosmalen,
The Netherlands. pp.
23-34.
Schulte, D. D., R. A.
Eigenburg, M. R. Peterson, J. A. Neinaber, and R. L. Korthals. 1994. Evaluation of Waste Management
Decision Making Tools. Balancing
Animal Production and the Environment.
Proceedings, Great Plains Animal Waste Conference on Confined Animal
Production and Water Quality. GPAC
Publication No. 151, October 19-21, 1994, Denver, Colorado, pp. 154-160.
Senthilselvan,
A., Y. Zhang, J. A. Dosman, E. M. Barber, L. E. Holfeld, S. P. Kirychuk, Y.
Cormier, T. S. Hurst, and C. S. Rhodes.
1997. Positive Human Health
Effects of Dust Suppression with Canola Oil in Swine Barns. American Journal of Respiratory and
Critical Care Medicine. Vol.
156(2):410-417.
Shaw,
B. W. and C. B. Parnell, Jr.
1997. PM2.5
Emissions from Agricultural Sources.
ASAE Paper No. 974097.
Presented at the 1997 Annual International Meeting in Minneapolis, MN.
American Society of Agricultural Engineers, St. Joseph,
MI.
Shaw,
B. W., P. Buharivala, C. B. Parnell, Jr., and M. A. Demny. 1998. Emission Factors for Grain Receiving and
Feed Loading. Transactions of
the American Society of Agricultural Engineers. Vol. 41(3):
757-765.
Sheldon, R. 1993. Hydrogen Sulfide. In: Handbook of Hazardous Materials, pp.
367-375. Academic Press.
Shi, Y., D. B. Parker, N. A.
Cole, B. W. Auvermann, L. W. Greene.
1999. Soil Amendments for
Minimizing Ammonia Emissions from Feedyard Surfaces. Paper No. 99-4083,
presented at 1999 ASAE/CSAE Annual International Meeting, Toronto, Ontario,
Canada. July 18-21. 8p.
Smith, R. J. and P. J.
Watts. 1994a. Determination of Odor Emission Rates
from Cattle Feedlots: Part 1, A
Review. Journal of Agricultural
Engineering Research 57:145-155.
Smith, R. J. and P. J.
Watts. 1994b. Determination of Odor Emission Rates
from Cattle Feedlots: Part 2,
Evaluation of Two Wind Tunnels of Different Size. Journal of Agricultural Engineering
Research 58:231-240.
Stowell, R. R., S. Foster,
H. Keener, and D. Elwell.
2000. Ammonia Emissions from
a High-Rise Swine Finishing Facility.
Paper No. 004080, 2000 ASAE International Meeting, Milwaukee, WI. American Society of Agricultural
Engineers, St. Joseph, MI. 13
p.
Sullivan, J., G. Boesel, R.
Criswell, A. Larkin, and D. Leezer.
1999. Feedlot Air Quality
Summary: Data Collection, Enforcement and program Development. Minnesota Pollution Control Agency,
Minneapolis, MN 133
p.
Summer, W. 1971. Odor Pollution of Air - Causes and
Control. The Chemical Rubber
Company Press, Cleveland, Ohio.
310p.
Sutton, A. L., K. B.
Kephart, J. A. Patterson, R. Mumma, D. T. Kelly, E. Bogus, D. D. Jones and A.
Heber. 1997. Dietary Manipulation to Reduce Ammonia
and Odor Compounds in Excreta and Anaerobic Manure Storages. Proc. Inter. Symp. Ammonia and Odour
Control from Anim. Prod. Facilities.
pp. 245-252. Vinkeloord,
NL.
Sutton, A. L., J. A.
Patterson, O. L. Adeola, B. T. Richert, D. T. Kelly, A. J. Heber, K. B. Kephart,
R. Mumma and E. Bogus. 1998. Reducing Sulfur Containing Odors through
Diet Manipulation. Proc. Inter.
Conf. Anim. Prod. Systems and the Environ.
Des Moines, IA. pp.
125-130.
Sutton, A. L., K. B.
Kephart, M. W. A. Verstegen, T. T. Canh and P. J. Hobbs. 1999. Potential for Reduction of Odorous
Compounds in Swine Manure through Diet Modification. Journal of Animal Science. 77:430-439.
Sweeten, J. M., D. L.
Reddell, L. Schake, and B. Garner.
1977. Odor Intensities at
Cattle Feedlots. Transactions of
the American Society of Agricultural Engineers. 20(3):502-508.11.
Sweeten, J. M., D. L.
Reddell, A. R. McFarland, R. O. Gauntt, and J. E. Sorel. 1983. Field Measurement of Ambient Odors with
a butanol Olfactometer.
Transactions of the American Society of Agricultural
Engineers.
26(4):1206-1216.
Sweeten, J. M., C. B.
Parnell, R. S. Ethredge, and D. Osborne.
1988. Dust Emissions in
Cattle Feedlots. Veterinary
Clinics of North America: Food Animal Practice
4(3):557-577.
Sweeten, J. M. 1990. Cattle Feedlot Waste Management
Practices for Water and Air Pollution Control. Texas Agricultural Extension Service,
Texas A&M University System.
B-1671, 24 pp.
Sweeten, J. M., R. C.
Childers, J. S. Cochran, and R. Bowler.
1991. Odor Control from
Poultry Manure Comporting Plant Using a Soil Filter. Applied Engineering in
Agriculture, 7(4): 439-449.
Sweeten, J. M. and J. R.
Miner. 1993. Odor Intensities at Cattle Feedlots in
Nuisance Litigation. Bioresource
Technology.
45:177-188.
Sweeten, J. M., R. E.
Childers, K. Stokes, and D. Smith.
1993. Planning Worksheets
for Manure and Wastewater Management Systems, CBR, 1993 Software Catalog, Texas
Agricultural Extension Service, Texas A&M University, College Station,
Texas.
Sweeten, J. M. 1995. Odor Measurement Technology and
Applications: A State of the Art Review.
In: Proceedings of the International Symposium on Agricultural and Food
Processing Wastes, Chicago, Illinois, ASAE-The Society for Engineering in
Agricultural, Food, and Biological Systems. pp 214-229.
Sweeten, J. M. 1998. Separation Distances for Swine Odor
Control in Relation to Manure Nutrient Balances. Applied Engineering in
Agriculture, 14(5):543-549.
Sweeten, J. M., C. B.
Parnell, B. W. Shaw, and B. W. Auvermann.
1998. Particle Size
Distribution of Cattle Feedlot Dust Emissions. Transactions of the American Society
of Agricultural Engineers.
41(5):1477-1481.
Sweeten, J. M., N. A. Cole,
D. B. Parker, and B. W. Auvermann. 1999. Detecting and Reducing Ammonia
Emissions from Dairies and Cattle Feedlots: A Review. Proceedings, Workshop on
Atmospheric Nitrogen Compounds II: Emissions, Transport, Transformation,
Deposition, and Assessment. North Carolina Department of Environment and Natural
Resources and North Carolina State University, Raleigh, North Carolina. June 7.
(In Press).
Sweeten, J. M. 2000a. Manure and Wastewater Management for
Cattle Feedlots. In: (D. P. Morgan,
ed.), Review of Environmental Contamination and Toxicology,
167:121-153.
Sweeten, J. M., C. B.
Parnell, B. W. Auvermann, B. W. Shaw, and R. E. Lacey. 2000b. Livestock Feedlots. Food and Agricultural Industry. In: Air Pollution Engineering Manual
(W. T. Davis, ed.). John Wiley
& Sons, Inc. pp.
488-496.
Sweeten, J. M. 2000c. Personal Communication. Texas Agricultural Experiment Station,
Amarillo, TX.
Tamminga, S. 1992. Gaseous Pollutants by Farm Animal
Enterprises. In: C. Phillips and D.
Piggins (eds.), Farm Animals and the Environment. CAB International, Wallingford,
U.K. pp.
345-357.
Tanaka, A. 2000. Effects of Finished Compost Used for a
Part of Amendments on Composting.
Paper No. 004077, 2000 ASAE International Meeting, Milwaukee, WI. American Society of Agricultural
Engineers, St. Joseph, MI. 9
p.
TCFA. 2000. Cattle Feeders Annual, Texas Cattle
Feeders Association, Amarillo, Texas.
pp. 116-119.
Thorne,
P. S., K. J. Donham, and J. Dosman.
1996. Understanding the
Impacts of Large-Scale Swine Production: Occupational Health Issues. University of Iowa Press.
Thorne, P. S., K. J. Donham,
J. D. Dosman, P. Jagielo, J. A. Merchant, and S. von Essen. 1996. Occupational Health. In: Thu, K (ed) Understanding the
Impacts of Large-Scale Swine Production, pp. 153-193. The University of Iowa, Iowa City,
Iowa.
Thu, K. (ed). 1996. Understanding the Impacts of Large-Scale
Swine Production. The University of
Iowa, Iowa City, Iowa.
Thu, K., K. J. Donham, R. Ziegenhorn, S. Reynolds, P. S. Thorne, P. Subramanian, P. Whitten, and J. Stookesberry. 1997. A Control Study of the Physical and Mental Health of Residents Living Near a Large-Scale Swine Operation. Journal of Agricultural Safety and Health 3(1): 13-26.
USDA/EPA. 1998. Draft Unified National Strategy for
Animal Feeding Operations U.S. Department of Agriculture & U.S.
Environmental Protection Agency.
September 11, 1998, p.93. http://www.epa.gov/cleanwater/afo.
USEPA. 1986. Supplement A to Compilation of Air
Pollution Emission Factors, Section 6.15 Beef Cattle Feedlots (Stationary Point
and Area Sources, vol 1).
AP-42. Office of Air Quality
Planning and Standards, Research Triangle Park, NC.
USEPA. 1987. 40CFR50, Revision to the National
Ambient Air Quality Standards for Particulate Matter and Appendix J -- Reference
Method for the Determination of Particulate Matter as PM-10 in the
Atmosphere. Federal Register
52(126):24634, 24664-24669.
USEPA. 1992. Anthropogenic Methane Emissions in the
U. S. Office of Air and Radiation, U. S. Environmental Protection Agency,
Washington D. C.
U. S.
Environmental Protection Agency.
1994. Compilation of Air
Pollutant Emission Factors - Volume I: Stationary Point and Area Sources. AP-42 (GPO 055-000-00251-7). Fifth Edition. U. S. Environmental Protection Agency,
Research Triangle Park, NC.
July.
Van Zeeland,
A. J. A. M., G. M. den Bok, M. G. A. M. van Asseldonk, and N. Verdoes. 1999. Ammonia Emission of Large Groups of
Weaned Piglets on a Floor Area of 0.4m2 per Piglet. Report 1.224, Research Reports - 1999,
Research Institute for Pig Husbandry, Rosmalen, The Netherlands. p. 35-36.
Varel, V. H., J. A. Nienaber
and H. C. Freetly. 1999. Conservation of Nitrogen in Cattle
Feedlot Waste with Urease Inhibitors.
Journal of Animal Science.
77:1162-1168.
Verdoes, N. and J. J.
Zonderland. 1999. The effect of a Chemical Air Scrubber on
Ammonia Emission from a Growing-Finishing-Pighouse. Report No. P4.39, Research Reports - 1999, Research Institute for Pig Husbandry,
Rosmalen, The Netherlands. p.
40.
Von Essen, S. and J. K.
Donham. 1999. Illness and Injury in Animal Confinement
Workers. Paper presented at Kansas
State University, Manhattan, KS.
February 18.
Walker, J. T., V. P. Aneja,
and D. A. Dickey. 2000. Atmospheric Transport and Wet Deposition
of Ammonium in North Carolina.
Atmospheric Environment.
34(2000):3,407-3,418.
Wark, W. and C. F. Warner.
1981. Air Pollution - Its origin and Control. (Second edition). Harper Collins
Publishers. New York, N. Y.
Warn, T. E., S. Zelmanowitz,
and M. Saeger. 1990. Development and Selection of Ammonia
Emission Factors for the 1985 NAPAP Emissions Inventory. EPA-600/7-90-014. Prepared by the U. S. Environmental
Protection Agency, Washington D. C. for the National Acid Precipitation
Assessment Program.
June.
Watts, P.J. 1991. The Measurement of Odours: A Discussion Paper for Australia. AMLRDC Report No. DAQ. 64/5. Feedlot Services Group, Queensland
Department of Primary Industries, Toowoomba, QLD. 40 p.
Watts, P. J., M. Jones, S.
C. Lott, R. W. Tucker, and R. J. Smith.
1994. Feedlot Odor Emissions
Following Heavy Rainfall.
Transactions of the American Society of Agricultural
Engineers.
37(2):629-636.
White, R. K., E. P.
Taiganides, and C. D. Cole.
1971. Chromatographic
Identification of Malodors from Dairy Animal Waste. pp. 110-113. In: Proceedings, Livestock Waste
Management and Pollution Abatement.
American Society of Agricultural Engineers, St. Joseph, Michigan
49085. ASAE Publication
PROC-271.
White, R. K., C. L. Barth,
D. C. Ludington, and J. R. Miner.
1974. Sampling and Analysis
of Gases/Odors. Paper No. 74-4544,
American Society of Agricultural Engineers, St. Joseph, Michigan. 19p.
Wing, S. and S. Wolf. 1999. Intensive Livestock Operations and
Quality of Life Among Eastern North Carolina Residents. Report to the North Carolina Dept. of
Health and Human Services, Raleigh, NC.
Woodford, P. 2000. Personal Communication. Colorado Department of Public Health and
Environment, Denver. July
7.
Wright, G.D. 1994. Air Sampling Methods for Gaseous
Pollutants. In: (Wright, G.D., ed.)
Fundamental of Air Sampling.
Lewis Publ. Ann Arbor,
MI. pp
99-110.
Xue, S. K. and S. Chen. 1999. Surface Oxidation for Reducing Ammonia
and Hydrogen Sulfide Emissions from Dairy Manure Storage. Transactions of the American Society
of Agricultural Engineers.
42(5):1401-1408.
Xue, S. K., S. Chen, and R.
E. Hermanson. 1999. Wheat Straw Cover for Reducing Ammonia
and Hydrogen Sulfide Emissions from Dairy Manure Storage. Transactions of the American Society
of Agricultural Engineers.
42(4):1095-1101.
Zahn, J. A., J. L. Hatfield,
Y. S. Do, A. A. DiSpirito, D. A. Laird and R. L. Pfeiffer. 1997. Characterization of Volatile Organic
Emissions and Wastes from a Swine Production Facility. Journal of Environmental
Quality.
26:1687-1696.
Zhang, R., T. Yamamoto, and
D. S. Bundy. 1996. Control of Ammonia and Odors in Animal
Houses by a Ferroelectric Plasma Reactor.
IEEE - Transactions of Industrial Applications. 32(6):113-117.
Zhang, Z., M.J. Yang and J.
Pawliszyn. 1994. Solid-Phase Microextraction. Analytical Chemistry. 66:844A-853A.
Zhu, J., G. L. Riskowski,
and M. Tornemorell. 1999. Volatile Fatty Acids as Odor Indicators
in Swine Manure: A Critical Review.
Transactions of the American Society of Agricultural
Engineers. 42(1):175-182.
Table 1. Comparison of Animal Emission Factors
(kg NH3/animal/yr) Battye et al. (1994).
|
|
Asman
(1992) |
Buijsman et al.
(1987) |
NAPAP
(1990) |
Battye et al. (1994)
composite | |||
|
Animal |
Stable +
storage |
Spreading |
Grazing |
Total | |||
|
Cattle (beef &
dairy) |
7.396 |
12.244 |
3.403 |
23.043 |
18. |
12.6 |
22.9 |
|
|
(1.6-12.9) |
(3.6-21.2) |
(2.8-8.2) |
(5.2-39.7) |
|
|
|
|
|
|
|
|
|
|
|
|
|
Swine |
2.521a |
2.836a |
0 |
5.357a |
2.8 |
3.35 |
9.1 |
|
|
(2.4-8.1) |
(2.8-8.0) |
0 |
(5.2-16.1) |
|
|
|
|
|
|
|
|
|
|
|
|
|
Poultry (chickens,
turkeys, ducks, etc.) |
0.095 |
0.154 |
0 |
0.249 |
0.26 |
0.071 |
0.179 |
|
|
(0.05-0.64) |
(0.10-0.64) |
0 |
(0.12-1.8) |
|
|
|
|
|
|
|
|
|
|
|
|
|
Horses |
3.9 |
3.6 |
4.7 |
12.2 |
9.4 |
-- |
-- |
|
|
|
|
|
|
|
|
|
|
Sheep
(ewes) |
0.381 |
0.693 |
0.623 |
1.697 |
3.1 |
1.85 |
3.37 |
a Battye et al. (1994) stated
that these composites appear to have been calculated using the incorrect number
of swine in the Netherlands and are therefore too low; corrected values would be
4.0, 4.5, and 8.5 respectively.
Table 2. Measured Ammonia
Flux Rates and Emission Factors from North Carolina Swine Lagoon (Aneja et al.,
2000a).
Average Daily
Ammonia
Flux Rate, FgN/m2/minute
Emission
Factors
Month
Mean ±SD
Max
Min
Kg/hd/yr
August 1997
4,017 ± 987
8,526
2,358
5.2
December
1997
844 ± 401
1,913
369
1.1
February
1998
305 ± 154
695
90
0.4
May 1998
1,706 ± 552
3,594
851
2.2
Average
1,718 ± 523
2.2
Table 3. Current USEPA National Ambient Air
Quality Standards (NAAQS).
Criteria Pollutant |
Averaging Time |
Concentration |
|
1. Particulate Matter
(PM10) | ||
|
Primary
|
Annual arithmetic
mean |
50 mg/m3 |
|
Primary
|
24-hour |
150 mg/m3 |
2. Carbon
Monoxide | ||
|
Primary
|
1-hour* |
35
ppm |
|
Primary
|
8-hour* |
9
ppm |
3. Nitrogen
Dioxide | ||
|
Primary
|
Annual arithmetic
mean |
0.053
ppm |
|
Secondary |
Same as
primary |
Same as
primary |
4. Sulfur
Dioxide | ||
|
Primary
|
Annual arithmetic
mean |
0.03
ppm |
|
Primary
|
24-hour* |
0.14
ppm |
|
Secondary |
3-hour* |
0.5
ppm |
5. Ozone | ||
|
Primary
|
8-hour |
0.08
ppm |
|
Secondary |
Same as
primary |
Same as
primary |
6. Lead | ||
|
Primary |
Calendar
quarter |
1.5 mg/m3 |
* This concentration is not to be
exceeded more than once per year.
ppm = parts per
million, mg/m3 = micrograms
per cubic meter
Table 4. Emission
calculations for four dairies (California) using emission factors of 70, 15, and
4 lbs/1000hd/day.
|
Dairy Facility
Parameters |
Dairies |
Totals | |||
|
A |
B |
C |
D | ||
|
Land Area
(acres) |
857 |
1,013 |
2,174 |
5,534 |
9,398 |
|
Milk
Cows |
3,931 |
4,597 |
10,348 |
24,803 |
43,679 |
|
Calves |
3,629 |
4,244 |
9,552 |
22,896 |
40,321 |
|
Total
Herd |
7,560 |
8,840 |
19,900 |
47,700 |
84,000 |
|
Area per head
(ft2/hd) |
1115 |
976 |
947 |
985 |
- |
|
Annual PM10
emission based on 70 lbs/1,000 hd/day (cows only),
tons |
50 |
59 |
132 |
317 |
558 |
|
Annual PM10
emission based on 15 lbs/1,000 hd/day (cows only),
tons |
11 |
13 |
28 |
68 |
120 |
|
Annual PM10
emission based on 4 lbs/1,000 hd/day (cows only),
tons |
3 |
4 |
8 |
18 |
33 |
Table 5. Cattle feedyard
emission factors determined using the ISC3 model and the modified Peters and
Blackwood (1977) approach, referred to as the TAMU procedure (McGee,
1997).
|
Feedyard |
Mean,
Net 24-hour
Measured Concentrations TSP |
ISC3
Modeled Emission Factors TSP |
TAMU
Procedure modeled Emission Factors TSP |
TAMU
Procedure Emission Factors PM10 |
|
(mg/m^3) |
(lbs/1000hd/d) |
(lbs/1000hd/d) |
(lbs/1000hd/d) | |
|
A (45,000
hd) |
589 |
97 |
103 |
26 |
|
B (42,000
hd) |
267 |
50 |
48 |
12 |
|
C (17,000
hd) |
363 |
96 |
103 |
26 |
|
Grand
Mean |
412* |
81 |
82 |
20 |
* 412 mg/m3 is the grand
mean of the downwind minus upwind concentrations reported by Sweeten et al.
(1988) and is not intended to represent the mean of the
column.
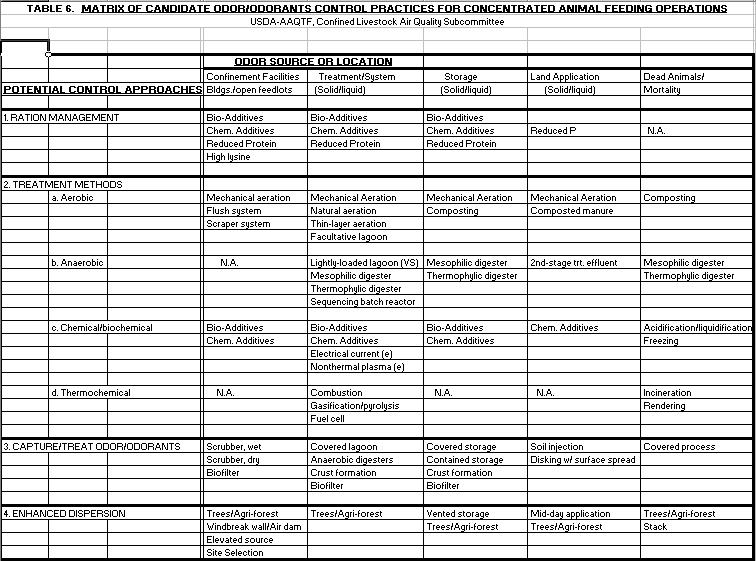

Table 8. Recommended research program related to
air quality regulations of agricultural odors.
|
Objectives/Sub-Objectives |
Recommended
Support |
CAFO Related | ||||
|
Agricultural odors
remain a complex issue with both a measurable component based on the
presence of small amounts of specific gas molecules and a more subjective
component based on individual sensitivity. Support for expanded research
activities is needed to fill the gaps between technology development and
the needs of agricultural producers and the
public. |
$2
M/yr |
ü |
| |||
|
Expanded research
support is required in the following areas to better identify and measure
odors, determine the relationship between odorous compounds and the
environment, identify human response to odors, and identify economical
control methods and reduction strategies. § Determine whether odors or specific
odorants are useful measures of other contaminants that are more difficult
to detect. Determine
relationships between biological particulate matter and odors as a
function of distance from a site. |
$1
M/yr |
ü |
| |||
|
Determine odor sources
from agricultural production and the impact of design and management
practices on odor release and transport. § Develop understanding of chemistry of
anaerobic impoundments and develop new methods that can reduce odors and
enhance treatment. (Example
-- development of inexpensive cover that is an aerobic biological reactor
which oxidizes hydrogen sulfide and ammonia.) |
$1
M/yr |
ü |
| |||
|
Improved dispersion
modeling methodology including odor release, transport, and receptors.
§ Determine whether air quality beyond
property lines may be improved by using structural barriers, trees and
other vegetation to adsorb odors and chemicals and potentially enhance
dispersion. |
$1
M/yr |
ü |
| |||
|
Standardized
measurement methodology, technologies and devices for odor detection
including frequency, intensity, duration, and
offensiveness. |
$1
M/yr |
ü |
| |||
|
Determine the chemical
and physical properties of odor including odor production processes,
interaction of environmental variables, odor release pathways,
interactions among odorants, and kinetics. § Assess potential relationships between
emission constituents and their concentration levels and health symptoms
of neighbors. |
$1
M/yr |
ü |
| |||
|
Development and
implementation of economically and technologically feasible odor control
and reduction strategies. § Develop technologies to reduce odors
and emissions for housed animals, treatment and land application
systems. |
$1
M/yr |
ü |
| |||
|
Priority #3 Total = $8
million/year |
| |||||
|
|
|
| ||||
|
These recommendations
are based on several meetings of the Agricultural Air Quality Task Force,
analysis of existing research and a review of the
literature. § Modified by addition of draft
Sub-Objectives, Confined Animal/Livestock Air Quality Subcommittee,
November 1999. |
| |||||
APPENDIX
A
Assumptions and Errors
Incorporated in Development of Original EPA
AP-42 Emission Factor for
Cattle Feedlots
(Parnell, 2000)
The only
science base for the EPA AP-42 PM10 emission factor for cattle
feedyards was Peters and Blackwood (1977).
Peters and Blackwood used the following assumptions in their development
of a cattle feedyard emission factor:
·
The infinite line source
Gaussian model would be the most appropriate model to back-calculate an emission
factor. The equation representing the infinite line source model is as follows
(Wark and Warner, 1981):
 (Eq 1.)
where:
C10 =
steady state concentration ‘x’ meters downwind from the source, micrograms per
cubic meter (mg/m3)
(This concentration is assumed to be a 10-minute concentration because the
spread parameters associated with Gaussian dispersion modeling (sy
and
sz) were based
upon 10-minute concentration measurements.);
QL =
emission rate, grams per meter per second (g/m/s);
sz =
vertical spread parameter, meters (m) (This parameter is a function of downwind
distance ‘x’ and atmospheric stability.);
u = average wind
speed, meters per second (m/s); and
H = height of emission,
m.
·
downwind distance ‘x’ was 50m
(best estimate);
·
wind speed (u) was 4.47 m/s
(national average);
·
stability class was
‘C’(national average);
·
height of emission (H) was
3.05 m (10 feet);
·
vertical spread parameter
(sz) was 4m {sz =
61(.05).911};
·
Peters and Blackwood
converted the reported 24-hour concentrations reported by Algeo et al (1972) to
10-minute concentrations using the model recommended in Wark and Warner (1981)
as follows:
|
|

·
It was assumed that there
were an average of 8,000 head on each feedyard. This was the average number of
cattle on all feedyards in California.
It was also assumed that the cattle spacing was 150 square feet per head
and the yards were square. These assumptions resulted in a source that was 334
meters square. They used a square feedyard with 330 meters on each side. Equation 1 can be simplified by
inserting the assumptions specified above as follows:
|
|
Solving for
QL, we get the following:
|
|
A thorough
analysis of the Peters and Blackwood (1977) report yielded the
following:
·
Peters and Blackwood made a
mistake in calculating their reported QL values. They calculated the QL for
the average net downwind concentrations for each of the 25 feedyards reported by
Algeo et al., using an equation similar to equation 4 but their coefficient was
24.2 *10-6 instead of 30 * 10-6. (We were unable to
determine why they used the different number.) They used equation 5 instead of
equation 4.
|
|
Our initial thought was that they had revised their
assumption and that the height of the emitting source was zero meters instead of
3.05 meters. This would seem logical since the source is a ground level source.
If H = 0, the coefficient in equation 4 is 22.4 * 10-6. We feel that
a more appropriate calculation of QL would be equation
6.
|
|
·
The overall
average, measured, net downwind concentration reported by Algeo et al (1972) was
654 mg/m3.
Converting this 24-hour concentration (C1440) to a 10-minute
concentration (C10) using equation 2, we get 1485 mg/m3.
·
Using 1624
mg/m3
in Equation 5 as Peters and Blackwood (1977) did, we get QL=
0.036 grams per meter per second (g/m/s).
·
Peters and
Blackwood (1977) did not know the number of head of cattle that were on each of
the 25 feedyards used in the Algeo et al. (1972) study. They assumed that the
average number of cattle on the 25 feedyards was 8,000 head and that each yard
was square. With the spacing of 150 square feet per head, the yard would be 330m
by 330m. They calculated the cattle feedyard emission factor (EF) as
follows:
EF=(0.036 g/m/s
* 330 m * 3600 s/h
* 24 h/d)/(454
g/lb * 8) =283
lbs/1000hd/d (TSP)
·
If the
emission rate (QL) had been calculated with equation 6 (H=0) which we
feel was more appropriate since the source of PM was at ground level (H=0),
QL = 0.033 g/m/s. The cattle feedyard emission factor (EF) with a
QL = 0.033 g/m/s is 259 lbs/1000hd/d (TSP).
·
Grelinger and Lapp (1976) reported a
personal communication with Algeo where he indicated that the average number of
head of cattle on the yards he sampled were 20,000 to 25,000 instead of 8,000.
Using 0.033 g/m/s and average number of 22,500 head on each square feedyard with
dimensions of 560m by 560m, the cattle feedyard emission factor is 156
lbs/1000hd/d (TSP).
In summary,
Peters and Blackwood (1977) did the best they could with the available reported
information to develop a cattle feedyard emission factor. They made a mistake in
their calculation of the emission factor. Had they performed their calculation
correctly and found out that the average number of cattle on feed was 20,000 to
25,000 head, they would have had an emission factor of 156 lbs/1000hd/d (TSP)
instead of 280 lbs/1000hd/d (TSP). We felt that there were too many assumptions
and guesses in Peters and Blackwood’s development of the AP-42 emission factor.
We needed better data for concentrations measurements, meteorological
conditions, and number of head of cattle at the yards while sampling in order to
develop a more accurate PM10 emission factor.
Texas Cattle
Feedlots Particulate Study
Although,
Peters and Blackwood (1977) made errors in their development of a cattle
feedyard emission factor, they did develop a procedure for back-calculating
cattle feedyard emission factors from measured, net, 24-hour downwind
concentrations of TSP. The modified Peters and Blackwood procedure is as
follows:
·
Calculate C10 with
Equation 2;
·
Calculate QL with
equation 6;
·
Determine the side dimension
‘W’ in meters assuming that the cattle have a spacing of 150
ft2/head
·
Use Equation 7 to calculate
‘EF’ in lbs/1000hd/d (TSP).
Sweeten et al.
(1988) reported 24-hour sampling data from Texas feedyards with capacities of
45,000, 17,000 and 42,000 head of cattle. One of the significant findings of
this study was the PM10/TSP ratio. The average PM10/TSP
ratio was reported to be 25%. EPA accepted this ratio and most SAPRA use the
PM10 emission factor of 70 lbs/1000hd/d ( ¼ * 280).
Parnell et al.
(1999) reported results of a study funded by the TNRCC that a more accurate
annual PM10 emission factor would be 15 lbs/1000hd/d. This factor was
the result of a study that included sampling, back-calculating emission factor
using ISC3 and annualizing the result by a factor of 0.79. The average
number of cattle on the three yards reported by Sweeten et al. (1988) was 35,000
head. If this average feedyard (35,000 head) were square, it would have an
average side dimension (W) of 700m by 700m. The average 24-hour concentration was
412 mg/m3
(TSP). Using a similar procedure, C10 = 959 mg/m3
(TSP) (Eq. 2), QL = 0.0215 g/m/s (Eq 6.), and the emission factor
would be 82 lbs/1000hd/d (TSP). Using 25% of TSP =
PM10, we would have a PM10 emission factor of 20
lbs/1000hd/d. If we annualize this by multiplying by 0.79 accounting for
rainfall events, we get 16 lbs/1000hd/d (PM10). Although we have used
a very different and more complicated method in our study for the TNRCC, our
resulting emission factor was 15 lbs/1000hd/d (PM10). The resulting
emission factor 16 lbs/1000hd/d
(PM10) was very nearly the same using the modified Peters and
Blackwood procedure.
In summary, we
have found significant errors in the EPA report (Peters and Blackwood, 1977)
that is the basis for the AP-42 emission factor for cattle feedyards. We have
used Peters and Blackwood’s procedure with H=0 for a ground level source instead
of an emission source 10 feet in the air; used an infinite line source model
with the concentrations reported by Sweeten et al. (1988, 1998); and determined
that the emission factor should be 20 lbs/1000hd/d PM10 (uncorrected
for rainfall events) or 16 lbs/1000hd/d (annualized). The TAMU process for
obtaining cattle feedyard emission factors from 24-hour, measured, net downwind
concentrations is as follows:
1.
Convert 24-hour TSP
concentration to 10-minute TSP concentration using equation
2.
2.
Calculate the emission rate
(QL) using equation 6 (H=0).
3.
Determine the side dimension
(‘W’ meters) of a square yard with 150 square feet per head for the feedyard
having ‘N’ thousand head. .
4.
Use equation 7 to calculate
the cattle feedyard TSP emission factor (EF) in units of
lbs/1000hd/d.
5.
Multiply the TSP emission
factor (EF) by 0.25 to obtain the PM10 emission
factor.
6.
Annualize the PM10
emission factor by 0.79.
|
|
APPENDIX
B
ASAE Standards
·
Control of Manure
Odors
·
Design of Anaerobic Lagoons
for Animal Waste
APPENDIX
C
Glossary of
Acronyms
Appendix
C
GLOSSARY OF
ACRONYMS
1. General
Terms
AAQTF = USDA Agricultural
Air Quality Task Force
AED
= aerodynamic equivalent diameter
AFOs = animal feeding
operations
ARB
= Air Resources Board
ARDS = Acute Respiratory
Distress Syndrome
ASAE = American Society of
Agricultural Engineers
ASTM = American Society of
Testing and Materials
BBACT = Baseline Best
Available Control Technology
BMP
= best management practice
CAAA = Clean Air Act
Amendments
CAFOs = concentrated animal
feeding operations
CARB = California Air
Resources Board
CEQA = California
Environmental Quality Act
CERCLA = Comprehensive
Environmental Response, Compensation and Liability Act
CNMPs = Comprehensive
Nutrient Management Plans
CP
= commercial product
CRIA = Cumulative Risk Index
Assessment
CRIS
= Current Research Information System
DTFCO = dynamic triangle
forced-choice olfactometers
EAC
= electrostatic air cleaning
ED50 = Effective
Dose with 50% panelist detection
ELGs = effluent limitations
guidelines
EPCRA = Emergency Planning
& Community Right-To-Know Act
EQIP = Environmental Quality
Incentive Program (USDA-NRCS)
EU =
endotoxin
units
FDM
= Fugitive Dust Model
FTEs = Full Time
Equivalents
GAO
= General Accounting Office, U.S. Government
GC-FID = gas
chromatography-flame ionization detector
GC/MS = gas chromatography
and mass spectrometry
GIS
= Geographic Information System
HAP
= hazardous air pollutants
IAQ
= indoor air quality
ISC3 = Industrial Source
Complex/Version 3 Model
LTV
= lowest toxic values
MOU
= Memorandum of Understanding
MPCA = Minnesota Pollution
Control Agency
NAAQS = National Ambient Air
Quality Standards
NADP/NTN = National
Atmospheric Deposition Program/National Trend Network
NAPAP = National Acid
Precipitation Assessment Program
NOV
= Notice of Violation
NPDES = National Pollution
Discharge Elimination System
NRCS = Natural Resource
Conservation Service
OSHA = Occupational Safety
and Health
OU
= odor units
PPP
= pollution prevention plan
RCP
= reduced crude protein
RCPF = reduced crude protein
fiber
RQ
= reportable quantity
SAPRAs = state air pollution
regulatory agencies
SIP
= State Implementation Plan(s)
SWRCB = State Water
Resources Control Board
TAMU = Texas A&M
University
TCFA = Texas Cattle Feeders
Association
TLV
= threshold limit value
TMD
= total mood disturbances
TMDLs = Total Maximum Daily
Loads
TNRCC = Texas Natural
Resource Conservation Commission
TPDES = Texas Pollutant
Discharge Elimination System
TSP
= total suspended particulate
USDA = United States
Department of Agriculture
USDA-ARS = U.S. Department
of Agriculture-Agricultural Research Service
USDA-CSREES = U.S.
Department of Agriculture-Cooperative State Research, Education, and
Extension Service
USDA-NRCS = U.S. Department
of Agriculture-Natural Resources Conservation Service
USEPA = United States
Environmental Protection Agency
USFWS = U.S. Fish and
Wildlife Service
WHO
= World Health Organization
2. Chemical
Compounds
Al2 =
Aluminum
C =
Carbon
CaCl2 = Calcium
Chloride
CH4 =
Methane
CO2 = Carbon
dioxide
CP
= crude protein
H2S = Hydrogen
sulfide
HCl
= Hydrochloric acid
N =
Nitrogen
NBPT = N- (n-butyl)
thiophosphoric triamide
NH3 =
Ammonia
NH3-N = Ammonia -
nitrogen
NO
= Nitrous oxide
NO2 = Nitrogen
oxide
NOx = Nitrogen
oxide compounds
P =
Phosphorus
pH
= Alkalinity
PM
= particulate matter
S =
Sulfur
SO2 = Sulfur
dioxide
SO4 =
Sulfate
TN
= total nitrogen
VFA
= Volatile Fatty Acids
VOCs = volatile organic
compounds
3. Units of
Measure
bph
= bale–per-hour
Btu
= British thermal units
DT
= dilutions to threshold
OU
= Odor units; same as dilutions to threshold
PM10 =
particulate matter having aerodynamic-equivalent mass median diameter of 10
microns
ppb
= parts per billion
ppm
= parts per million
Fg/m3 = Micrograms
per cubic meter
Fg/m2/minute =
Micrograms per square meter per minute
APPENDIX
D
Other Recommended
Reading
Bottcher, R. W. 2000. Methods of Controlling Airborne
Emissions from Pig Farms.
Biological and Agricultural Engineering Department, North Carolina State
University, Raleigh, NC. 12 p.
Bottcher, R. W., K.M.
Keener, and R. D. Munilla.
2000. Comparison of Odor
Control Mechanisms for Wet Pad Scrubbing, Indoor Ozonation, Windbreak Walls, and
Biofilters. Paper No. 004091,
Presented at the ASAE International Meeting, Milwaukee, WI, July 9-12. ASAE, St. Joseph, MI.9
p.
Fakhoury, K. J., A. J.
Heber, P. Shao, and J. Q. Ni.
2000. Correlation of Odor
Detection Thresholds with Concentrations of Hydrogen Sulfide, Ammonia and Trace
Gases Emitted from Swine Manure.
Paper No. 004047, Presented at the ASAE International Meeting, Milwaukee,
WI, July 9-12. ASAE, St. Joseph,
MI.12 p.
Fritz,
B., A. Pargmann, C. B. Parnell, Jr. and B. W. Shaw. 2000. Calculating Emissions Inventories of
Field Operations in Texas.
Proceedings of the 2000 Beltwide Cotton Production Conferences, National
Cotton Council. Memphis,
TN.
Gralapp, A. K., W. J.
Powers, and D. S. Bundy. 2000. Comparison of Olfactometry, Gas
Chromatography, and Electronic Nose Technology for Measurement of Indoor Air
from Swine Facilities. Paper No.
004045, Presented at the ASAE International Meeting, Milwaukee, WI, July
9-12. ASAE, St. Joseph, MI.12
p.
Guo, H., L. D. Jacobson, D.
R. Schmidt, and R. E. Nicolai.
2000. Correlation of Odor
Dilution Threshold and H2S and NH3 Concentrations for Animal Feedlots. Paper No. 004043, Presented at the ASAE
International Meeting, Milwaukee, WI, July 9-12. ASAE, St. Joseph, MI. 11 p.
Jacobson, L. D., H. Guo, D.
R. Schmidt, R. E. Nicolai, J. Zhu, and K. A. Janni. 2000. Development of an Odor Rating System to
Estimate Setback Distances from Animal Feedlots: Odor From Feedlots—Setback Estimation
Tool (OFFSET). Paper No. 004044,
Presented at the ASAE International Meeting, Milwaukee, WI, July 9-12. ASAE, St. Joseph, MI. 27 p.
Kizil, U., S. Panigrahi, and
J. A. Lindley. 2000. Odor Sensor for Manure Management. Paper No. 004046, Presented at the ASAE
International Meeting, Milwaukee, WI, July 9-12. ASAE, St. Joseph, MI. 14 p.
Parnell,
C. B., Jr. 1984. Air Pollution Control for Agricultural
Processing Plants. In: Agriculture
and the Environment: An Examination of Critical Issues for Food Policy. (John M. Sweeten and Frank J. Humenik,
eds.). American Society of
Agricultural Engineers, St. Joseph, MI.
pp 107-117.
Parnell,
C. B. Jr., B. J. Lesikar, and B. W. Shaw.
1994. A Systems Approach to
Regulating Air Pollution from Grain Handling Facilities. ASAE Paper No. 944043, Presented at the
Summer Meeting of the American Society of Agricultural Engineers. Kansas City, MO. June.
Parnell,
C. B. Jr., B. W. Shaw, B. Auvermann, and J. McClure. 2000. Engineering of PM10 and
PM2.5 Samplers.
Proceedings of the 2000 Beltwide Cotton Production Conferences. National Cotton Council, Memphis,
TN.
Powers, W. J., H.H. Van
Horn, A.C. Wilke, C.J. Wilcox, and R. A. Nordstedt. 1999. Effects of Anaerobic Digestion and
Additives to Effluent or Cattle Feed on Odor and Odorant Concentrations. Journal of Animal Science, 77:
1412-1421.
Qu, G., J. J. R. Feddes, W.
Armstrong, J. Leonard, and R.Coleman.
1999. Combining an
Electronic Nose with and Artificial Neural Network to Measure Odour
Concentration. Paper No. 993203,
Presented at the ASAE/CSAE International Meeting, Toronto, Ontario, Canada, July
18-21. ASAE, St. Joseph, MI. 15 p.
Romanillos,
A., B. Auvermann, C. B. Parnell, Jr., and B. W. Shaw. 1999. Effect of Stocking Density on Fugitive
PM10 Emissions from a Cattle Feedyard. Paper No. 994192, Presented at the 1998
ASAE Annual International Meeting in Toronto Canada. American Society of Agricultural
Engineers, St. Joseph, MI.
Weinheimer,
B. T., J. F. Coleman, J. K. Green, C. B. Parnell, Jr., and B. W. Shaw. 1999. Evaluation of a Flaked Grain Cyclone Air
Lift System at a Feedyard. Paper
No. 994196, presented at the 1999 ASAE Annual International Meeting in Toronto
Canada. American Society of
Agricultural Engineers, St. Joseph, MI.
Williams,
L. J. and C. B. Parnell, Jr.
1996. Air Dispersion
Modeling as Part of the Regulatory Process. Paper presented at the First
International Conference on Air Pollution from Agricultural Operations, Midwest
Plan Service, Ames, IA.
Wood, S.L., E. F. Wheeler,
and K. B. Kephart. 2000. Reliability of Subjective Odor
Quantification Using the Refined Cloth Swatch Olfactometric Technique.
2000. Paper No. 004024, Presented
at the ASAE International Meeting, Milwaukee, WI, July 9-12. ASAE, St. Joseph, MI. 15 p.
Zhang, Z., T. L. Richard,
and D. S. Bundy. 1999. Effects of Organic Cover Biofilters on
Odors from Liquid Manure Storage. Paper No. 994087, Presented at the ASAE/CSAE
International Meeting, Toronto, Ontario, Canada, July 18-21. ASAE, St. Joseph,
MI.10 p.
Zwicke,
G. 1998. The Dispersion Modeling of Particulate
for Point and Multipoint Sources in Agriculture. Unpublished Master of Science
Thesis. Department of Agricultural
Engineering, Texas A&M University.
College Station, TX.
APPENDIX
E
USDA-Agricultural Research Service
·
National Program 203 Air
Quality
·
Air Quality
Component/National Program on Manure
and By-Product Utilization
Specific Program
Initiatives
Particulates
Understand and assess
emissions of primary particulates of 0.1 to 10 micrometer size by agricultural
operations, including burning and animal production, and wind erosion. Understand and assess emissions of
ammonia, pesticides, and other volatilized organic compounds as precursors to
secondary particles by agricultural operations.
Odors
Assess emission of odorous
compounds by agriculture, especially those released by animal operations. Understand microorganism-based processes
that produce odors, environmental effects on emissions and transport, and
impacts. Develop odor-mitigating
practices in the context of the entire animal operation.
Impact of Ground-Level Ozone on
Agriculture
Understand the bio-physical
processes by which ozone causes crop damage and of the interactions between
ozone and such other environmental factors as CO2 concentration. Understand ozone impacts on yield and
quality and mechanisms of plant response to ozone.
Pesticides and Other Organic
Compounds
Assess and understand the
processes of emissions of pesticides and other synthetic organic compounds. Quantify the unintentional airborne
movement of pesticides from agricultural sites, and determine the impact of
agricultural pesticide drift on non-target organisms on and off the
farm.
Ammonia and Ammonium
Emissions
Improve measuring and
monitoring technology and assess ammonia and ammonium emissions under field
conditions.
USDA-Agricultural Research
Service
Air Quality Component of
the
National Program on Manure and By-Product
Utilization
Specific Program
Thrusts
Develop Methods to Measure and
Quantify Emissions from Livestock Facilities
Methods will be developed to
accurately measure emissions, e.g. ammonia, particulates, odors, volatile
compounds and other greenhouse gases related to livestock facilities. These methods will be based on physical
and chemical properties including size and composition of particulates and
aerosols and will be reliable and reproducible across a wide range of
environments and animal production systems.
Determine Mechanisms Responsible for
Emissions
The
focus of this research will be to identify the underlying substrates and
processes involved in emissions with emphasis on the role of
microorganisms. The ecology of
aerobic and anaerobic microorganisms associated with emissions will be
determined, mechanisms to change the ecology or metabolism of organisms to
reduce undesirable emissions will be identified, and methods to promote
favorable changes in ecology or metabolism of these organisms will be
developed.
Quantify Emission Rates from
Livestock Production Systems
Emission rates of gases and
particulates will be determined in relation to manure handling, storage,
processing, and application practices commonly used in U. S. livestock
production systems. Emission will
be correlated with management practices to allow identification of best
management practices.
Determine Dispersion of
Gases and Particulates Across Complex Landscapes
Develop methods to predict
dispersion and transport of gases and particulates from animal production and
manure application sites. Determine
the influence of interactions among emissions (gases, particulates, and
aerosols) on atmospheric transport and dispersion.
Develop Cost-Effective Methods to
Reduce Problem Emissions
Research will be conducted
to determine if current best management practices can reduce emissions to
acceptable on-site and off-site levels.
Alternative management practices will be developed to reduce emissions
and achieve most efficient use of nutrients by animals.