5 CHARACTERIZATION OF RISK
Characterization of possible responses to exposures at the level of the organism has traditionally been conducted by comparison of the concentration of the stressor(s) found in the environment to the responses reported for that stressor(s) in the laboratory or the literature. This process is normally conducted in a series often, starting with conservative assumptions and progressing to more and more realistic assessments (Figure 13). The initial use of conservative criteria allows substances that truly do not present a risk to be eliminated from the risk assessment process, thus allowing the focus of expertise to be shided to more problematic substances. In the Report of the Aquatic Risk Assessment Dialogue Group (SETAC, 1994), it was suggested that four tiers be used in the risk assessment process for pesticides in aquatic ecosystems. These tiers began with a simple "worst-case" estimation of environmental concentration which was compared with the effect level for the most sensitive organism (the quotient approach). If the result of this comparison suggested no hazard, no regulatory action would be peeded. If the result suggested a potential risk, further tiers of risk assessment with more realistic and more complete exposure and effects data could be applied to the problem.
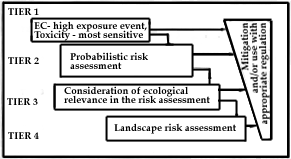 |
| Figure 13 Illustration of the tiers of risk assessment adapted from SETAC 1994). |
| Hazard = | Exposure
concentration __________________ Effect concentration |
or Margin of Safety = | Effect
concentration ___________________ Exposure concentration |
The calculation of quotients traditionally has been conducted by utilizing the susceptibility of the most sensitive organism or group of organisms and comparing this to the greatest exposure concentration. This may be made more conservative by the use of a safety factor to allow for unquantified uncertainty in the effect and exposure estimations or measurements.
The quotient model for ecological risk assessment fails to explicitly consider ranges of sensitivity in different species in the ecosystem, or ranges of concentration. Uncertainty factors are an attempt to account for these ranges but they may be excessively conservative or not conservative enough.
Expressing the results of an exposure or effects characterization as a distribution of values in a probabilistic approach rather than a single point estimate has the advantage of using all relevant single species toxicity data and, when combined with exposure distributions, allows quantitative expression of risks to communities of organisms (Health Council of the Netherlands, 1992; SETAC, 1994).
Probabilistic approaches to assessing and managing risks are not new. The probability of occurrence of a particular event is widely used in the characterization of risks from many physical and medical events in humans and for reduction in failure rate in mechanical and civil engineering projects (time between failures, one-in-one-hundred-year floods, etc.). Many of the issues in probabilistic risk assessment have been the subject of a recent journal debate (Power and McCarty, 1996; Anderson and Yuhas, 1996; Burmaster, 1996; Richardson, 1996). The extension of this concept is now being applied in ecological risk assessment for the characterization of both exposures and effects (Solomon et al., 1996; Klaine et al., 1996; Solomon, 1996).
5.1 ASSESSMENT OF CHLORINATED PHENOLICS SUBSTANCES 1N PULP MILL EFFLUENT
Mills routinely analyze efnuents for the presence of certain chlorinated compounds including the phenols and PCDD/PCDFs (see section 2). These data were used for a risk characterization conducted using a tiered approach as described above. A tier-one had characterization was conducted by comparison of the highest concentration of the substance reported from analyses of effluents from a number of mills using 100% chlorine dioxide (data collected from 1990 to the present) to the responses reported for that substance in the literature (NCASI, 1992). As several criteria are used to assess toxicity, these comparisons were treated differently. Where chronic toxicity was measured, a margin of safety of 10 was used, while, for acute toxicity a margin of safety of 100 was used. In the absence of chronic toxicity data, a MOS of 100 or more for an acute test may be considered protective of chronic responses (Sloof et al., 1986).
Only data for mills using 100% chlorine dioxide substitution were used in this hazard assessment. For some chlorinated phenols, concentrations above the limit of detection were not reported. These substances were: 2,3,4,5-Tetrachlorophenol (N = 26), 2,3,4,6-Tetrachlorophenol (N = 60), 2,3,4-Trichlorophenol (N = 17), 2,3,5,6-Tetrachlorophenol (N = 16), 2,3,5-Trichlorophenol (N = 16), 2,4,5-Trichlorophenol (N = 43), 2-Chlorophenol (N = 33), 3,4,5 Trichlorosyringol (N = 13), 3,4-Dichloroguaiacol (N = 5), 4,5-Dichloroveratrole (N = 39), 5,6-Dichlorovanillin (N = 24), Pentachlorophenol (N = 79), and Tetrachloroveratrole (N = 37). For those where concentrations above the limit of detection were reported, the highest concentration was compared to several toxicity endpoints (NCASI, 1992) as shown in Table 5.1. Only two of these substances (tetrachloroguaiacol and tetrachlorocatechol) produced margin of safety quotients less than the chosen criteria (100). Risks from these substances were assessed using a probabilistic approach.
Table 5.1 Toxicity criteria and hazard quotient for chlorinated compounds in mill effluents produced from bleaching processes with 100% chlorine dioxide substitution
| Substance | Species | Response criterion |
Response concentration (RC) µg/L |
Highest
environmental concentration reported (EC) µg/L |
RC / EC | Hazard | Hazard Criterion |
N |
| 2,4-Dichlorophenol | Rainbow trout fry |
96 h LC50 | 2600 | 0.4 | 6500 | low hazard | 100 | 34 |
| FW Biota | EPA acute criterion |
2020 | 0.4 | 5050 | low hazard | 10 | ||
| FW Biota | EPA chronic criterion |
365 | 0.4 | 913 | low hazard | 10 | ||
| 2,4,6-Trichlorophenol | Rainbow trout | 96 h LC50 | 730 | 1.5 | 487 | low hazard | 100 | 79 |
| 4-Chloroguaiacol | Zebrafish | Egg/Larvae NOEC |
700 | 1.2 | 583 | low hazard | 10 | 38 |
| 4,5-Dichloroguaiacol | Rainbow trout | 96 h LC50 | 2200 | 0.3 | 7333 | low hazard | 100 | 39 |
| Zebrafish | Egg/Larvae NOEC |
300 | 0.3 | 1000 | low hazard | 10 | ||
| 3,4,5-Trichloroguaiacol | Rainbow trout | 96 h LC50 | 750 | 4 | 188 | low hazard | 100 | 70 |
| Zebrafish | Egg/Larvae NOEC |
200 | 4 | 50 | low hazard | 10 | ||
| 4,5,6-Trichloroguaiacol | Rainbow trout | 96 h LC50 | 800 | 1.6 | 500 | low hazard | 100 | 65 |
| Zebrafish | Egg/Larvae NOEC |
300 | 1.6 | 188 | low hazard | 10 | ||
| Tetrachloroguaiacol | Rainbow trout | 96 h LC50 | 300 | 3.7 | 81 | low hazard | 100 | 79 |
| Zebrafish | Egg/Larvae NOEC |
200 | 3.7 | 54 | low hazard | 10 | ||
| 4-Chlorocatechol | Zebrafish | Egg/Larvae NOEC |
700 | 0.3 | 2333 | low hazard | 10 | 33 |
| 3,4-Dichlorocatechol | Salmon (O. nerca) | 96 h LC50 | 2700 | 0.1 | 27000 | low hazard | 100 | 38 |
| Algae (S. capricornutum) |
EC50 | 1800 | 0.1 | 18000 | low hazard | 100 | ||
| 3,5-Dichlorocatechol | Zebrafish | Egg/Larvae NOEC |
500 | 0.1 | 5000 | low hazard | 10 | 38 |
| 4,5-Dichlorocatechol | Rainbow trout | 96 h LC50 | 100 | 1 | 100 | low hazard | 100 | 39 |
| Zebrafish | Egg/Larvae NOEC |
500 | 1 | 500 | low hazard | 10 | ||
| 3,4,5-Trichlorocatechol | Rainbow trout | 96 h LC50 | 1000 | 2.5 | 400 | low hazard | 100 | 75 |
| Zebrafish | Egg/Larvae NOEC |
200 | 2.5 | 80 | low hazard | 10 | ||
| 3,4,6-Trichlorocatechol | Brown trout | 96 h LC50 | 900 | 1 | 900 | low hazard | 100 | 65 |
| Zebrafish | Egg/Larvae NOEC |
350 | 1 | 350 | low hazard | 10 | ||
| Tetrachlorocatechol | Rainbow trout | 96 h LC50 | 400 | 5.8 | 69 | some hazard | 100 | 77 |
| Zebrafish | Egg/Larvae NOEC |
150 | 5.8 | 26 | low hazard | 10 | ||
| Trichlorosyringol | Zebrafish | LOEC | 800 | 0.36 | 2222 | low hazard | 10 | 23 |
| 4,6-Dichloroguaiacol | No data | 0.2 | 33 | |||||
| 3,4,6-Trichloroguaiacol | No data | 0.3 | 53 | |||||
| 6-Chlorovanillin | No data | 2 | 6 | |||||
| 3,4,5-Trichloroveratrole | No data | 5.8 | 36 |
Measured exposure concentrations for tetrachloroguaiacol and
tetrachlorocatechol were ranked and percent plotting position calculated
as reported in Solomon et al. (1996). These ranks were plotted
against log of concentration (Figure 14). The most sensitive
toxicity data (Table 5.1)
were plotted on the graph. Given similar circumstances (100% chlorine
dioxide substitution and the same processes in the mill) and from the
graph, it is clear that the likelihood of a concentration greater than the
toxicity criteria for tetrachloroguaiacol and tetrachlorocatechol
occurring in the effluent is very low (less than 1%). Accordingly, the
risk is judged to be so low as to be negligible.
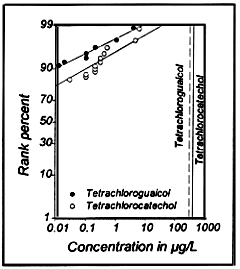 |
| Figure 14 Distributions of concentrations of tetrachloroguaiacol and tetrachlorocatechol from mills using 100% chlorine dioxide substitution compared to the most sensitive toxicity endpoint (vertical lines). |
Chlorophenols are generally believed to act through a common mechanism of action -- uncoupling of oxidative phosphorylation. As a result, it has been assumed that the toxicity of mixtures of two or more chlorophenols will interact additively. Kovacs et al. (1993) used toxicity data on freshwater and saltwater organisms to develop toxicity equivalency factors (TEFs) for chlorinated phenols in bleached kraft mill effluent. These TEFs can be used to calculate toxicity equivalencies (TEQs) using the toxicity of the most toxic chlorophenol, pentachlorophenol, as a means of converting the potency of components in a mixture into a common unit for assessment purposes. The TEFs that they estimated were:
| Pentachlorophenol
Tetrachlorophenols Trichlorophenols Dichlorophenols Monochlorophenols |
1 0.5 0.2 0.1 0.04 |
Many chlorophenols occuring in the effluents of pulp mills using ECF bleaching. Using these measured concentrations, and the TEFs from Kovacs et al., (1993), it was possible to combine the potency of these substances and express this as a pentachlorophenol TEQ (although pentachlorophenol itself was not detected in any of the effluents). These TEQs were based on measured co-occurrences and thus, when analyzed using the above distributional approach (Figure 14), can be used to assess the probability that total potency of the mixture will exceed an assessment criterion in the same way as distributional analysis was used to assess tetrachloroguaiacol and tetrachlorocatechol above. Because the data were collected over space (different mills) and time, the analysis is representative of all 100% ECF mills.
Results of this analysis (Figure 15 and Table 5.2) show that, even when the combined potencies of the chlorophenols are considered, the likelihood that the EPA FW chronic or acute criteria will be exceeded is low (Table 5.2). This does not suggest an ecologically significant risk. From the data in Figure 15, it would appear that the likelihood of exceedence in the post-1993 data set is slightly greater than the pre-1993 data set. This may be an artifact; the method used for calculating the plotting positions is responsive to the number of data points and is more conservative when fewer data are available. The availability of additional data would improve the usefulness of this analysis.
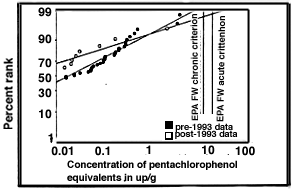 |
| Figure 15 Distributions of concentrations of all
chlorinated phenols from mills using 100% chlorine dioxide substitution expressed as pentachlorophenol TEQs and compared to assessment criteria for pentachlorophenol |
| Table
5.2 Probabilistic assessment of chlorophenol TEQs exceeding the EPA FW criteria |
| Data Source | y = ax + b | Percent probability of exceeding
EPA FW criterion |
|||
| a | b | r2 | Acute | Chronic | |
| Pre-1993 | 0.86 | 6.51 | 0.92 | 0.5 | 0.7 |
| Post-1993 | 0.52 | 6.49 | 0.91 | 1.5 | 1.9 |
Analysis of additional data on concentrations of chlorinated phenolic substances from mills using 100% chlorine dioxide since 1993 still shows that many of these substances are not detected in the effluents at all. Exposure concentrations of those substances that were detected in mill effluent were generally law and do not suggest that acute and chronic effects from individual substances are likely to result. Assessment of combined toxicity from all chlorinated phenols does not suggest ecologically relevant risks. This observation is a continuation of a trend observed in the previous review.