Smart
SamplingTM:
Making sensible
remediation decisions Smart SamplingTM is a process that
facilitates cleanup decisions by applying techniques,
methods, and software that have been developed in other
fields. Through the use of Smart SamplingTM,
site owners, regulators, and other stakeholders can
consider the effects of various action levels and risk
tolerances on the ultimate cost of a remediation plan.
Sandia National
Laboratory developed Smart SamplingTM
with support from the U.S.
Department of Energy's Office of Science and
Technology. The Smart SamplingTM
method has been demonstrated on a number of projects
since 1992, and it is ready for large-scale deployment.
During 1996, Smart SamplingTM
was demonstrated at Site 91 at SNL in Albuquerque, New
Mexico, where 13 test detonations between 1979 and the
late 1980s released 100,000 pounds of lead over the site.
Smart SamplingTM was
also demonstrated in 1998 at the Mound Plant in Ohio.
Decisions, decisions!
Smart SamplingTM
supports cleanup decision makers who must agree on the
cleanup goal and the level of risk to accept in deciding
on a remediation plan. For example, during negotiations
over plans at Site 91, Smart SamplingTM
helped decision makers understand the economic
consequences of selecting between two cleanup
goals—residential or industrial land use. The U.S.
Environmental Agency has set lead cleanup for a future
residential land use scenario at removal or treatment to
the 400 parts-per-million (ppm) action level. The
corresponding action level for industrial use is 2,000
ppm.
What are the risks?
The risk of any remediation plan is that it can
under- or overestimate the degree of cleanup required to
satisfy the action level. Proceeding with a plan that
overestimates the amount of soil that must be removed or
treated results in unnecessary added expense. Such a plan
is based on false positives. Remediation plans that
underestimate the amount of soil for removal or treatment
are based on false negatives; they fail to achieve
regulatory compliance, leading to fines, penalties, and
more remedial actions.
Smart SamplingTM is a
tool for illustrating the economic consequence of
accepting various levels of risk. For example, a
remediation plan based on a 5 percent probability that
remaining soil will exceed the action level will be less
expensive than a remediation plan based on a 1 percent
probability of leaving behind soil that exceeds the
action level. Smart SamplingTM
quantifies the tradeoffs between accepting higher levels
of risk and lower remediation costs.
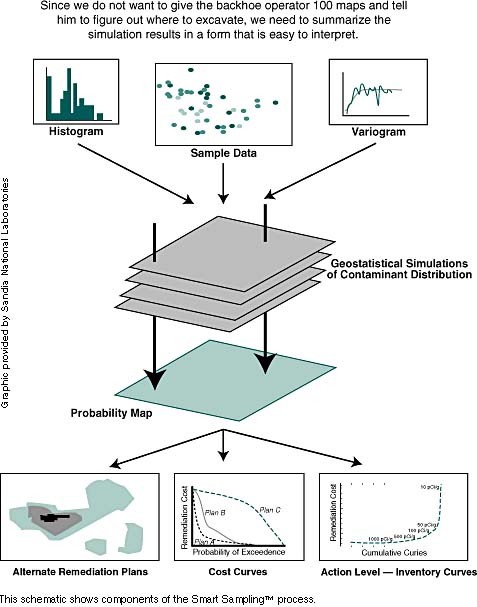
Taking Smart SamplingTM steps
Smart SamplingTM
is a generic process that can be applied at any site
where negotiating parties must decide to what level to
clean a site. Among the steps in the process are
- Histogram—From data
obtained on contaminant concentrations at sampled
locations, Smart SamplingTM
generates a histogram to display the known
distribution of contaminant concentrations.
- Variogram—A variogram is
generated to quantify the spatial correlation
that exists in geostatistics between pairs of
samples. In geostatistics, the differences in
values between pairs of samples will decrease as
their proximity to each other increases. Smart
SamplingTM
applies spatial correlation algorithms to sampled
values to predict values at unsampled locations.
A variogram is a graphical display of this
correlation.
- Geostatistical simulations—Next,
the Smart SamplingTM
process uses the histogram, the sample values and
locations, and the variogram to perform
geostatistical simulations. Many models are
generated to show likely concentrations and
distributions of the contaminant of interest
across a site. Each model accounts for all known
information and is equally plausible in
predicting concentration and distribution at
unsampled locations.
- Probability maps—Smart
SamplingTM
averages all the modeled values and maps them,
showing the likelihood that the true contaminant
value at any unsampled location exceeds the
selected action level. During its use at SNL,
Smart SamplingTM
produced four probability maps to help decision
makers understand how the lower action level (400
ppm as opposed to 2,000 ppm) and higher tolerance
for risk (5 percent as opposed to 1 percent)
affected the amount of soil to be removed and,
therefore, the cost of remediation. Probability
maps provide insight as to the most productive
and cost-effective alternatives for remedial
design, and they quantify the risks associated
with each alternative.
- Excavation maps—Smart
SamplingTM
generates excavation maps from the probability
maps by marking for cleanup those cells with the
selected probability of containing soil that
exceeds the action level (either 400 ppm or 2,000
ppm in the SNL case at Site 91).
- Cost curves—Seeing how
costs were affected by decisions about action
level and probability of exceedence helps
decision makers clarify their options and
understand the economic tradeoffs among various
combinations of action levels, more
characterization sampling, and negotiated levels
of uncertainty. At SNL's Site 91, Smart SamplingTM showed the parties
that if they were willing to accept a remediation
plan based on a 5 percent probability of leaving
soil that exceeded an action level of 2,000 ppm,
then they could save $6.6 million over a plan
with a 5 percent probability of exceeding the
400-ppm action level. Because all parties were
involved in setting cleanup and risk levels, the
resulting remediation plan was defensible.
Taking additional
samples
People responsible for cleanups may decide to take
additional samples to reduce the risk that undetected
contamination will be left in place. Taking additional
samples is economical when the data generated by
additional samples reduce the cost of remediation beyond
the cost of taking the samples. Smart SamplingTM allows for the use of
several algorithms to determine sample locations with the
greatest potential of reducing uncertainty and
contributing to a cost-effective cleanup.
At Site 91, 20 random follow-up samples were taken to
validate the geostatistical model. For each additional
sample location, the sample value was compared with the
distribution of lead concentrations predicted through
geostatistical simulation. The variability between
measured values and predicted values was dependent on
proximity of new sample locations to original sample
locations. Comparing data from the new locations with
values for these locations generated through
geostatistical simulation showed that Smart SamplingTM was effective in preventing
false negatives (where contaminated soil is incorrectly
classified as uncontaminated and left behind at the
site). For example, the accuracy of the remediation
decision based on a 2,000-ppm action level at a 0.05
probability of exceedence was found to be 85 percent (17
correct decisions for the 20 extra sampled locations).
One false negative and two false positives were
identified.
Smart SamplingTM at the Mound Plant
A recent demonstration of Smart SamplingTM at DOE's Mound Plant in
Miamisburg, Ohio provides another illustration of how the
method can help negotiating parties make cost-effective
and defensible remediation decisions. In 1969, a rupture
in an underground pipeline released waste from a
plutonium processing facility at the Mound Plant.
Although a cleanup action was carried out in 1969,
samples taken during the next 24 years showed that a
1-mile section of the abandoned Miami-Erie Barge Canal
was contaminated.
Making decisions about the canal's cleanup lies with
DOE, the Ohio EPA Office of Federal Facilities Oversight,
the U.S. EPA Region V, and local citizens. Recently, DOE
and the regulators authorized a demonstration of Smart
SamplingTM to learn how
the process could help the parties agree on a remediation
plan that removes all soil where the probability of
exceeding 75 picocurries per gram (pCi/g) of plutonium is
greater than or equal to 5 percent. A second goal of
cleanup is to remove all soil where the probability of
exceeding 150 pCi/g is greater than 1 percent. The
parties also want to accomplish cleanup at reasonable
cost.
To restrict the scope of the demonstration, only three
sections of the canal (of 150 sections) were chosen to
exemplify how Smart SamplingTM
supports decision making. One hundred fifty-two samples
were obtained and analyzed on site.
The Smart SamplingTM
process culminated with an excavation plan for removing
about 95 percent of the plutonium at a cost of $67,000.
The site's original excavation plan would remove about 97
percent of the plutonium at a cost of $108,000. Smart
SamplingTM also
generated a cost curve that illustrated the diminishing
returns from additional excavation. Regulators, site
owners, and others saw the cumulative effect on cost of
removing more soil and higher percentages of plutonium.
For more information about Smart SamplingTM, see its page
on Sandia National Laboratories' Web site (http://www.nwer.sandia.gov/sample).
Contacts include Paul Kaplan, Sandia National
Laboratories, (505) 284-4786, [email protected],
and Anthony Armstrong, Oak
Ridge National Laboratory, (423) 576-1555, [email protected].
An Innovative
Technology Summary Report on Smart SamplingTM is scheduled
for release in 1998 by the Office of Science and
Technology.
|