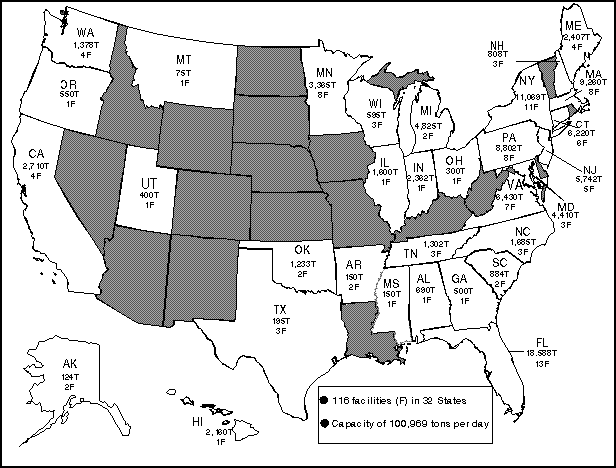
T = Tons per day.
F = Facility.
Source: Figure developed by the Energy Information Administration, based on data from Eileen B. Berenyi and Robert N. Gould, Resource Recovery Year (New York, NY: Government Advisory Associates, Inc., 1993), pp. 229-670, updated with
1994 and 1995 data by telephone.