VOLUME LANDFILLED(a) (PER TON OF MSW)
 Click here to expand figure.
This section describes emissions for the 11 major integrated MSW management strategies for which energy balances were shown in Table 2.2. The electronic data base prepared for this study allows users to estimate energy balances for integrated strategies consisting of any combination of the waste management technologies covered in this report (see Section 4). However, the emissions data available for the less commonly used technologies are so sparse that the results of comparisons of strategies that include those technologies would be highly unreliable. Therefore, coverage of those strategies is excluded from this section.
Air Emissions
Air emissions for an MSW management strategy arise from many sources. The types and amounts of these emissions vary widely, as shown in Table 3.2. The rates of release also vary substantially for different strategies. Transportation releases occur only while the MSW or recyclables are in transit; combustion and MRF processing and recycling also release emissions quickly. Composting and land filling release emissions for periods ranging from months to the full 20 years covered in this analysis (or more for land filling).
                                        Table 3.1

                      QUALITATIVE DESCRIPTIONS OF EMISSIONS FROM MAJOR MSW TECHNOLOGIES


         Technology                                         Emission

Transportation                   Quantified:     Nitrogen oxides NO(x), carbon monoxide (CO), particulates,
                                                 hydrocarbons
                                 Unquantified:   Dust, noise

Landfill with gas                Quantified:     Methane, carbon dioxide CO(2}, and nonmethane organic gases
recovery(a)                                      (NMOC) escaping the gas collection system; CO(2) released
                                                 from combustion of the methane; leachate collected for treatment
                                                 and leachate that escapes through the liner; metal and organic
                                                 content of each leachate stream
                                 Unquantified:   Emissions from the construction equipment used to operate
                                                 the landfill; dioxin/furan or metals, if any, from combustion
                                                 of landfill gas

Mass burning(a)                  Quantified:     NO(x), CO, CO(2), water H(2)O, metals, dioxin/furans, sulfur
                                                 dioxide S0(2), hydrochloric acid (HCI) from stack; emissions
                                                 from the equipment used to operate the landfill; metal content
                                                 of leachate and leachate amount collected for treatment from
                                                 the ash landfill, and the amount escaping through the liner
                                 Unquantified:   Emissions from transport to and operation of an ash monofill

Preparation and combustion       Quantified:     NO(x), CO, CO(2), H(2)O, metals, dioxin/furans, SO(2), HCI,
of  RDF                                          from stack; metal content of leachate and leachate amount
                                                 collected for treatment from the ash landfill, and the amount
                                                 escaping through the liner; methane emissions and NMOC escaping
                                                 collection from the raw MSW landfill; metal content of leachate
                                                 and leachate amount collected for treatment from the ash landfill,
                                                 and the amount escaping through the liner
                                 Unquantified:   Emissions from the equipment used to operate the landfill;
                                                 emissions from transport to and operation of an ash monofill

Collection/separation/           Local:
recycling(a)                     Quantified:     Additional emissions from collection, residue from
                                                 processing recyclables
                                 Unquantified:   Emissions from a MRF processing facility (dust, organic gases)

                                 Regional:
                                 Unquantified:   Transportation emissions to the point of remanufacture, emissions
                                                 from remanufacture compared to emissions from original manufacture;
                                                 transportation of raw materials to point of manufacture

Composting(a)                    Quantified:     Emissions from separate collection trucks for curbside collection
                                                 of yard waste; emissions from equipment for processing the compost
                                 Unquantified:   Emissions during composting and curing; air and water emissions from
                                                 land application of the compost; transportation of the compost
                                                 to the point of use


                            (a)                  Emissions from landfills will continue beyond the 20-year period
                                                 covered in this analysis; landfill emissions after 20 years are
                                                 unquantified for all technologies.
Click here for table in WK1 format.
                                                                      Table 3.2
                                                   AIR EMISSIONS FOR COMMON STRATEGIES
                                          (Pounds  per Ton  of MSW  atthe Curb -Total for 20 Years)

                                                             Strategy  (see key)
                                  1         2         3         4         5         6         7         8         9         10        11
Air Emissions

Particulates                     0.02     0.086      0.07      0.05      0.46      0.02      0.08      0.05      0.02      0.47      0.47
Carbon monoxide                  0.79      1.47      1.33      2.06     23.24      0.94      1.55      2.09      0.94     23.39     23.94
Hydrocarbons                     0.08      0.08      0.08      0.08      2.32      0.09      0.09      0.09      0.09      2.34      2.34
Nitrogen Oxides                  0.32      5.1       4.1       2.64      9.30      0.38      4.7       2.47      0.38      9.36      9.36
Methane                         14.34      0.00      0.00      2.29     13.82     13.05      0.00      2.06      5.16     12.47      0.00
Carbon dioxide                   437       1650      1320      1460      421       397       1485      1313      157       379       1440
Water                            188       1140      912       970       180       171       1026      872        68       164       992
NMOC                             0.75      0.00      0.00      0.12      0.72      0.68      0.00      0.11      0.37      0.65      0.00
Dioxin/furan                      NA      0.014     0.011     0.0038      NA        NA      0.012     0.0034      NA        NA      0.011
Sulfur                            NA       2.45      1.96      1.10       NA        NA       2.21      0.99       NA        NA       2.13
Hydrogen                          NA       1.40      1.12      0.26       NA        NA       1.26      0.24       NA        NA       1.22


Metals{10(-6)lb}

Antimony                          NA        NA        NA        ND        NA        NA        NA        ND        NA        NA        NA
Arsenic                           NA       4.1       3.3        ND        NA        NA       3.69       ND        NA        NA       3.6
Cadmium                           NA       8.0       6.4        ND        NA        NA       7.2        ND        NA        NA       6.9
Chromium                          NA        19        15        87        NA        NA        17        78        NA        NA       16.5
Lead                              NA        10       8.0       320        NA        NA        9        288        NA        NA       8.7
Mercury                           NA       230       184        55        NA        NA       207        50        NA        NA       200
Nickel                            NA        17        14        64        NA        NA        15        57        NA        NA       14.8
Zinc                              NA        NA        NA       170        NA        NA        NA       153        NA        NA        NA
Total Metals{10(-6)lb}            NA       288       230       696        NA        NA       259       626        NA        NA       251


Source: SRI International

Notes: ND=Not detected        NA=Not analysed     NMOC= Non-Methane Organic Compounds

Key:
1 = Landfill with Gas Recovery          7 = Curbside MRF + Mass Burn
2 = Mass Burn                           8 = Curbside MRF + RDF for Direct Firing
3 = On-site MRF + Mass Burn             9 = Curbside MRF + RDF for Composting
4 = RDF for Direct Firing               10 = Curbside MRF + Landfill + Yard Waste Composting
5 = Yard Waste Composting + Landfill    11 = Curbside MRF + Mass Burn + Yard Waste Composting
6 = Curbside MRF + Landfill
Click here for table in WK1 format.
In general, strategies that handle the largest percentage of the waste by landfilling release the largest quantities of organic gases to the air; those emissions consist mainly of methane, with about 2% of the methane by volume as other organics, including halogenated organics (FR, l991b), and accompanying CO(2) (O'Leary and Walsh, 1991). Landfilling and other organic processes (composting, anaerobic digestion) release extremely small quantities of metals, if any.
In contrast, strategies that make the greatest use of combustion release the largest quantities of CO(2) and metals to the air. Combustion emissions include almost no organics, but extremely small quantities of dioxins and furans are emitted (as shown in Table 3.2).
Collection and Transportation
MSW management includes curbside collection of the waste, transportation of the waste to a landfill or a processing facility (e.g., a combustor or a materials recovery facility), and possibly transportation of the residue from processing to a landfill. Although many models of collection and transportation requirements for various types of collection programs have been developed, it proved difficult to find actual data on energy and emissions for these steps. Accordingly, this study used data on transportation energy requirements supplied by one community. The city had operated a curbside collection program for recyclables for many years, and it initiated a program for curbside collection of yard waste about a year before this study began. It is not necessarily typical of other communities.
The community supplied data on actual tonnages collected by each truck in each of the three separate collection programs; the number of trucks operated and the number of miles traveled by each truck; and the fuel consumption on each route. Fuel use per ton of material picked up on each route was lowest for collecting household and commercial MSW. About 2.5 times more fuel was used to pick up a ton of separated recyclables, and about 600 times more fuel was used to collect a ton of yard waste (because of the small quantities collected on each route in that program).
To develop the estimates presented in this summary, these fuel use rates were converted to energy use per ton of MSW at the curb, and then apportioned according to the amounts set out. The energy and emissions results are extremely sensitive to the amount collected by each truck. Therefore, energy use per ton of material collected increases as additional curbside collection programs are implemented.
No direct emission measurements for MSW collection or curbside collection vehicles have been made during actual operation. Emissions from collection and transportation were therefore estimated on the basis of the actual fuel use by assuming that the emissions per unit of fuel met the maximum permissible emission limits for heavy-duty diesel truck engines operating according to a specified EPA procedure that simulates freeway and city driving. When these engine limits have been compared to actual emissions from vehicles under the same load and speed conditions, the results vary by 20-50% for emissions of different types; for example, the operating vehicles emit larger quantities of hydrocarbons and particulates, but smaller amounts of nitrogen oxides and carbon monoxide than the tested engines. The duty cycle of the MSW packer trucks in these tests is quite different, in terms of stop-start frequency and compactor operation, from the typical duty cycle for the trucks modeled by the EPA. Therefore, in developing emissions estimates for this study, the emissions limits were increased by a factor of four to provide a better approximation of actual emissions.
Water Emissions
Most leachate is formed when rainwater enters a closed landfill. Environmental concerns about landfills include the amount of hazardous material (metals, organics, dioxins, and other components of MSW) that is removed from the landfill by leaching, and the final destination of the leachate. Table 3.3 shows the effluent estimates for the ll major integrated waste management strategies compared in this section.
Note, however, that this analysis does not cover leachates that might result from the waste from processes that remanufacture paper, metals, and plastics separated from MSW for recycling. Few data were found on those potential emissions.
Most new landfills are capped when they are filled, and regulations require that all new landfills that receive more than 20 tons per day of MSW have a liner and a leachate collection system, and treat the collected leachate (FR, l991n). Regulations mandate a collection and treatment period of approximately 30 years, unless the leachate does no harm to human health and the environment. Control can be required for more than 30 years if the leachate is judged a threat to human health and the environment (FR, l991o). In spite of capping, liners, and leachate collection and treatment, about 25% of the rainwater that falls on a landfill can leak in, and 13% of the amount that enters the landfill can escape the collection system and leak out through the liner (Ovary and Walsh, 1991).
Ash from large municipal waste combustors (MWCs) is usually separately landfilled (in areas called "ash monofills"). Because the volume of ash is smaller than that of the original MSW, rain falls on a smaller area in ash monofills, and leachate per ton of MSW is one-eighth to one-tenth as great as leachate from MSW landfills. No data on water that leaks into ash monofills were found; thus, the comparisons in this section are based on the assumption that the percentages of rainwater leaking into and out of a monofill are the same as those for an MSW landfill.
Estimates of both the amounts of metals in the captured leachate and the amounts that escape to the ground under ash monofills are provided in Section 6. Very little organic material remains in the ash after combustion, so organics in leachate from ash monofills are extremely low. About one ten-thousandth of a pound of organics per ton of MSW is leached over the entire 20-year period(1). Organics in leachate from an MSW landfill total about 0.16 pound during that time.(2)
Because leachate is released continuously over the 20-year period, the concentrations of the metals and organics at any given time are quite low. For example, the concentration of lead in the MSW leachate is 90 ug per liter; lead in leachate from an ash monofill declines to less than 1 ug per liter within 2 years. In comparison, a typical drinking water standard for lead permits about 50 ug per liter (O'Leary and Walsh, 1991; Roffman, 1991).
                                                        Table 3.3

                                              EFFLUENT  FOR COMMON  STRATEGIES

                                   (Pounds per Ton of MSW at the Curb-Total for 20 Years)

                                                                                Strategy - (see key)
                                     1           2           3           4           5           6           7           8           9           10          11
Effluent
Leachate (gallons)                   80        10.08        8.0        18.29       77.12       72.80        9.07       16.46        28.8       69.60        8.77
Leachate                            667          84          67         152         643         607         75.6        137         240         580          73
Chloride                            1.13        1.17        0.94        0.82        1.09        1.03        1.05        0.74        0.41        0.98        1.02
Sodium                              0.73        0.26        0.21        0.26        0.7         0.66        0.23        0.23        0.26        0.63        0.23
Potassium                           0.60        0.14        0.11        0.17        0.58        0.56        0.12        0.15        0.21        0.52        0.12
Chemical oxygen demand              0.16         NA          NA         0.02        0.15        0.15         NA         0.02       0.056        0.13         NA
Total organic carbon                 NA        0.0003      0.0002     <0.0002        NA       <0.0002      0.0002     <0.0002        NA          NA        0.0002

Metals {10(-3)lb}
Arsenic                              86          ND          ND         13.8        82.9         78          ND         12.4         31         74.8         ND
Cadmium                             3.0          ND          ND         0.48        2.89        2.73         ND         0.43        1.08        2.61         ND
Chromium                            163          ND          ND        26.10        157         148          ND         23.5         59         142          ND
Copper                               43          ND          ND         6.88        41.5        39.1         ND         6.19         15          37          ND
Nickel                              108          ND          ND        17.30        104          98          ND         15.6         38          94          ND
Lead                                 48          ND          ND         7.68        46.3         43          ND         6.91         17          42          ND
Mercury                             6.0          ND          ND         0.96        5.78        5.46         ND         0.86        2.16        5.22         ND
Zinc                                 NA          ND          ND          NA          NA          NA          ND          NA          NA          NA          ND
Total Metals {10(-3)lb}             457          ND          ND        73.10        440         416          ND         65.8        163         270          ND


 Source:  SRI International
 Notes:  ND= Not detected        NA= Not analyzed

 Key:  1 = Landfill with Gas Recovery                 7 =  Curbside MRF + Mass Burn
       2 = Mass Burn                                  8 =  Curbside MRF + RDF for Direct Firing
       3 = On-Site MRF + Mass Burn                    9 =  Curbside MRF + RDF for Composting
       4 = RDF for Direct Firing                     10 =  Curbside MRF + Landfill + Yard Waste Composting
       5 = Yard Waste Composting + Landfill          11 =  Curbside MRF + Mass Burn + Yard Waste Composting
       6 = Curbside MRF + Landfill
Click here for table in WK1 format.
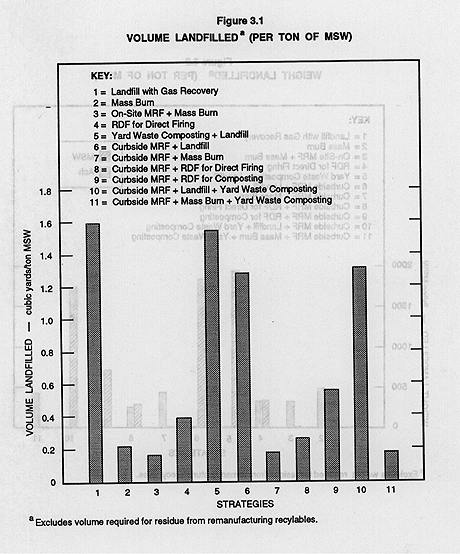
Landfill Space
The maximum capacity of a landfill is usually determined by volume, not weight. images/Figure 3.1 compares landfill volumes required by the 11 major MSW management strategies. images/Figure 3.2 shows the same data in terms of weight (tons of residue to be landfilled for each ton of MSW at the curb processed by the various technologies). The differences among the technologies are less dramatic when they are reported by weight.
In terms of landfill space saved, the various strategies for managing MSW fall into two categories: strategies that involve combustion and those that do not. The land area consumed for MSW management is smallest if recoverables are separated, the remaining waste is burned, and the ash from combustion is landfilled; it is largest if all waste is landfilled.
MSW combustion technologies reduce the need for landfill volume by up to 90% (FR, l991a) because the ash is dense compared to raw or compacted MSW. When separation of metals and glass precedes combustion, the residual volume is further reduced. The combination of mixed waste recycling and mass burning or RDF preparation and combustion requires less landfill space than any other MSW management strategy evaluated in this report. Adding curbside recycling before combustion is almost as effective in reducing landfill space requirements as using mixed waste recycling with combustion of the residue. Some RDF combustion technologies reject material to the landfill before combustion, and those require a larger total landfill volume than is needed when all the MSW is burned.
Collection and separation of recyclables saves about 90% of the landfill space required for the amount collected at the curbside, which currently averages about 16% of the volume of MSW (12% by weight) in communities that have successful curbside collection programs and market the separated products; however, landfill or waste disposal space is required for impurities generated during the remanufacturing of the recyclables. An MSW management strategy that involves preparation of RDF and composting of the RDF reduces the volume of landfilled material by 50-60% if the compost can be used (recycled). Even if the compost is landfilled, composting saves about 15-25% of the landfill space.
The amount of landfill space that can be saved by composting separately collected yard waste is not well known. In the community used as a model for the data on transportation distances and participation rates for composing in this study, separately collected yard waste for composing had little impact on landfill volume because actual participation rates were low. In general, compacting in a landfill achieves smaller volume reductions for yard waste than for packaging (Franklin Associates 1990a); as a result, the elimination of yard waste from the landfill saves less space than would be expected on the basis of the weight of the yard waste.
images/Figure 3.1
VOLUME LANDFILLED(a) (PER TON OF MSW)
Click here to expand figure.
images/Figure 3.2
WEIGHT LANDFILLED(a) (PER TON OF MSW)
 Click here to expand figure.
NOTES:
(1) Measured as total organic carbon; estimates were calculated from Roffman (1991).
(2) Measured as chemical oxygen demand.
-OR-