Determining how much energy is used, saved, or avoided through recycling requires a complex analysis. Energy requirements for the entire recycling process include not only those for operations associated with the MSW management strategy, but also those for industries that remanufacture the products based on recycled materials. Energy is required for:
The energy expended at the municipal level for collection is included in the data base, which shows the net difference between energy used to collect all MSW together in a packer truck and the energy used if separate collection of recyclables is added. In the comparison, the data base not only adds the energy for separate collection, but also somewhat reduces the energy for collecting all MSW to reflect the smaller quantity of refuse that is picked up in the packer truck at each stop.
The subsection called "Integrated Strategy Example" compares the energy and emissions for separate collection of reusable materials with those for consolidated collection of all MSW. In the community that was used as the basis for this comparison, the energy requirement per ton of collected material was found to be about 30% greater for separate curbside collection than the requirement for collecting a ton of mixed refuse in a single packer truck(4).
Processing
Table 7.1 shows estimated energy requirements for the operation of an MRF. These estimates are based on documentation submitted with bids for constructing an MRF, rather than on actual operating data. No data on energy consumption for an existing plant were found.
                                       Table 7.1

                 ENERGY REQUIREMENTS FOR OPERATING AN MRF
                   (Btu per Ton of Incoming Material)

     Processing Facility                         Energy        Reference

     Curbside-collected, separated, high tech            200,000          Tellus, 1990
     Mixed waste MRF, high tech                          150,000          wTe, 1992
     Mixed waste MRF, low tech                           110,000          wTe, 1992
Click here for table in WK1 format.
Energy Saved
Determining the energy saved by recycling is more complex than determining how much energy is recovered by MSW combustion and used to generate electricity. In the case of recycling, it is necessary to compare all the energy needed to manufacture an article from virgin material (including mining the ore, logging the trees, etc.) with all the energy needed to manufacture the same articles using some percentage of recycled material.
Net Energy Balance for Remanufacturing
To determine the amounts of energy used and saved for remanufactured materials made from the separated recyclables, the products had to be identified. For this analysis, the following assumptions were made:
Energy savings can be computed on several different bases, and a range of valid assumptions could be made. The assumptions for the estimates shown in Figures 7.3-7.5 are as follows:
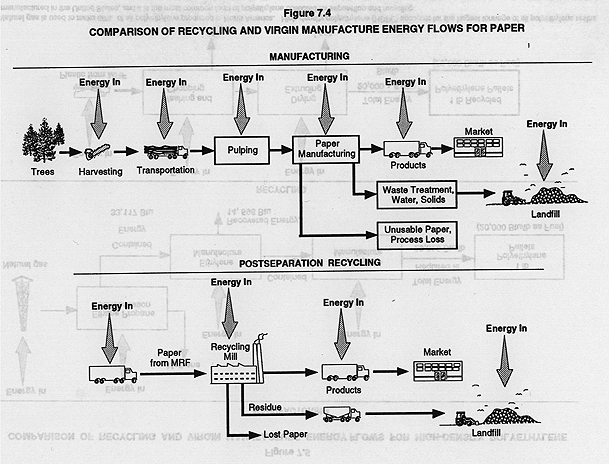
Figure 7.4
COMPARISON OF RECYCLING AND VIRGIN MANUFACTURE ENERGY FLOWS FOR PAPER
Figure 7.5
COMPARISON OF RECYCLING AND VIRGIN MANUFACTURE ENERGY FLOWS FOR HIGH-DENSITY POLYETHYLENE
Btus for extracting and transporting oil to the point of conversion into plastic were included, but the Btu content in the virgin oil or gas that became the resin was excluded. These simplifying assumptions are valid only when the recycled plastic is legitimately substituting for the same virgin resin. The recycled material need not be applied to the same end use of the plastic; for example, refining used polyethylene terephthalate (PET) bottles into fiberfill displaces other PET.
Analysis of energy savings for paper remanufacture is more complicated than determining the energy savings for aluminum or steel manufacture because:
Published estimates of the energy savings achieved by recycling vary from 10 million Btu per ton of paper product to zero. According to preliminary results of an ongoing study for recycling of newsprint alone, energy savings vary widely, depending on the assumptions made in the comparison (see Exhibit VII).
Special Issues
Two special issues related to energy analysis of recycling should be mentioned here:
Energy Saving from Repeated Recycling. An uncertainty in conducting a life-cycle analysis that includes recycling is the effect of the 20-year period that is being considered for energy savings and releases in this report. The number of times the same material is recycled will affect the amount of energy that is saved over 20 years. The energy analysis used in the data base assumes that, for example, an aluminum can recycled displaces the energy needed to manufacture the aluminum needed for a new can from virgin resources (taking into account smelting losses). That assumption actually represents the maximum energy that could be saved; it thus overestimates the actual saving for all materials that already are recycled to a reasonable extent.
Nationwide about 62% of all aluminum beverage cans were recycled in 1990, and some can makers managed to buy more used cans than they made (Powell, 1992). When a can is recycled, about 13% of the metal is lost in shredding and resmelting (Kusik and Kenahan, 1979). If 62% of all cans are recycled, the recycled metal accounts for 54% of the new cans made from the mix of new metal and used cans.
Production of a can that consists entirely of recycled metal saves 80% of the energy need to produce the same can from virgin aluminum (Sellers and Sellers, 1989). For a can that is 54% recycled metal, the energy saving is 43%. A series sum for an infinite number of recycles shows that the maximum energy savings is 1.18 times the energy saved in the first recycle. If it is assumed that a can will be recycled "infinitely" over the 20-year period covered in this analysis, the total energy saving is 50% of the energy needed to make a new can from virgin metal.
Similar analyses can be made for paper, glass, and plastic. Because percentages of energy saved by recycling are lower for these materials than for aluminum, the total energy saving is smaller.
Transportation of Separated Materials for Remanufacture
Table 7.2 presents estimates developed for this report of energy consumed to transport materials from the point of separation (at the MRF) to the point of reuse or remanufacture, and compares those estimates with the energy required to transport the virgin raw materials to the point of original manufacture. (The assumptions on which the estimates in Table 7.2 were based are detailed in Exhibit II) The table shows that transportation energy to the point of remanufacture is a small percentage of the total energy of manufacture. Waste paper is excluded from the comparison. Despite an extensive search, no data on transportation distances for waste paper were found.
Clearly, variations between communities in the distances that separated products might travel to a remanufacturing site might be large. However, because the energy needs for transportation of the separated materials to remanufacture averaged to be a small percentage of energy of remanufacture, their contribution is not considered separately in the data base variables.
                                                 Table 7.2
             COMPARISON OF TRANSPORTATION ENERGY REQUIREMENTS FOR VIRGIN MATERIALS
                             AND SECONDARY MATERIALS SHIPPED FOR RECYCLING

                                  Transportation Energy             Share of Total
Material                          (Million Btu/Net Ton)        Manufacturing Energy (%)            Source

Glass containers                            0.386                                 2.2                           Kusik and Kenahan, 1979

Glass containers, recycled                  0.48(a)                               2.7                           SRI estimate

Steel slab, blast furnace,
and BOF                                     0.46                                  2.3                           Battelle,1975

Steel sheet electric furnace,
100% scrap                                  0.46                                  5.6                           Kusik and Kenahan, 1978

Aluminum ingot(b)                           2.7(t)                                1.1                           Battelle, 1975

Recycling aluminum cans to
can sheet                                   0.46                                  5.3                           Kusik and Kenahan, 1978


(a) New glass containers have a limited shipping distance before a new plant is built; a probable range of 200 miles
    at 0.0024 million Btu per ton-mile was assumed(Battelle, 1975).
(b) Ocean shipping of the bauxite accounts for 85% of the total transportation energy(Battelle, 1975).
Click here for table in WK1 format.-OR-
 Click here to expand figure.
 Click here to expand figure.